Experimental

Open source · Python & Qt · macOS, Linux, Windows

A desktop home for your
Fortran projects

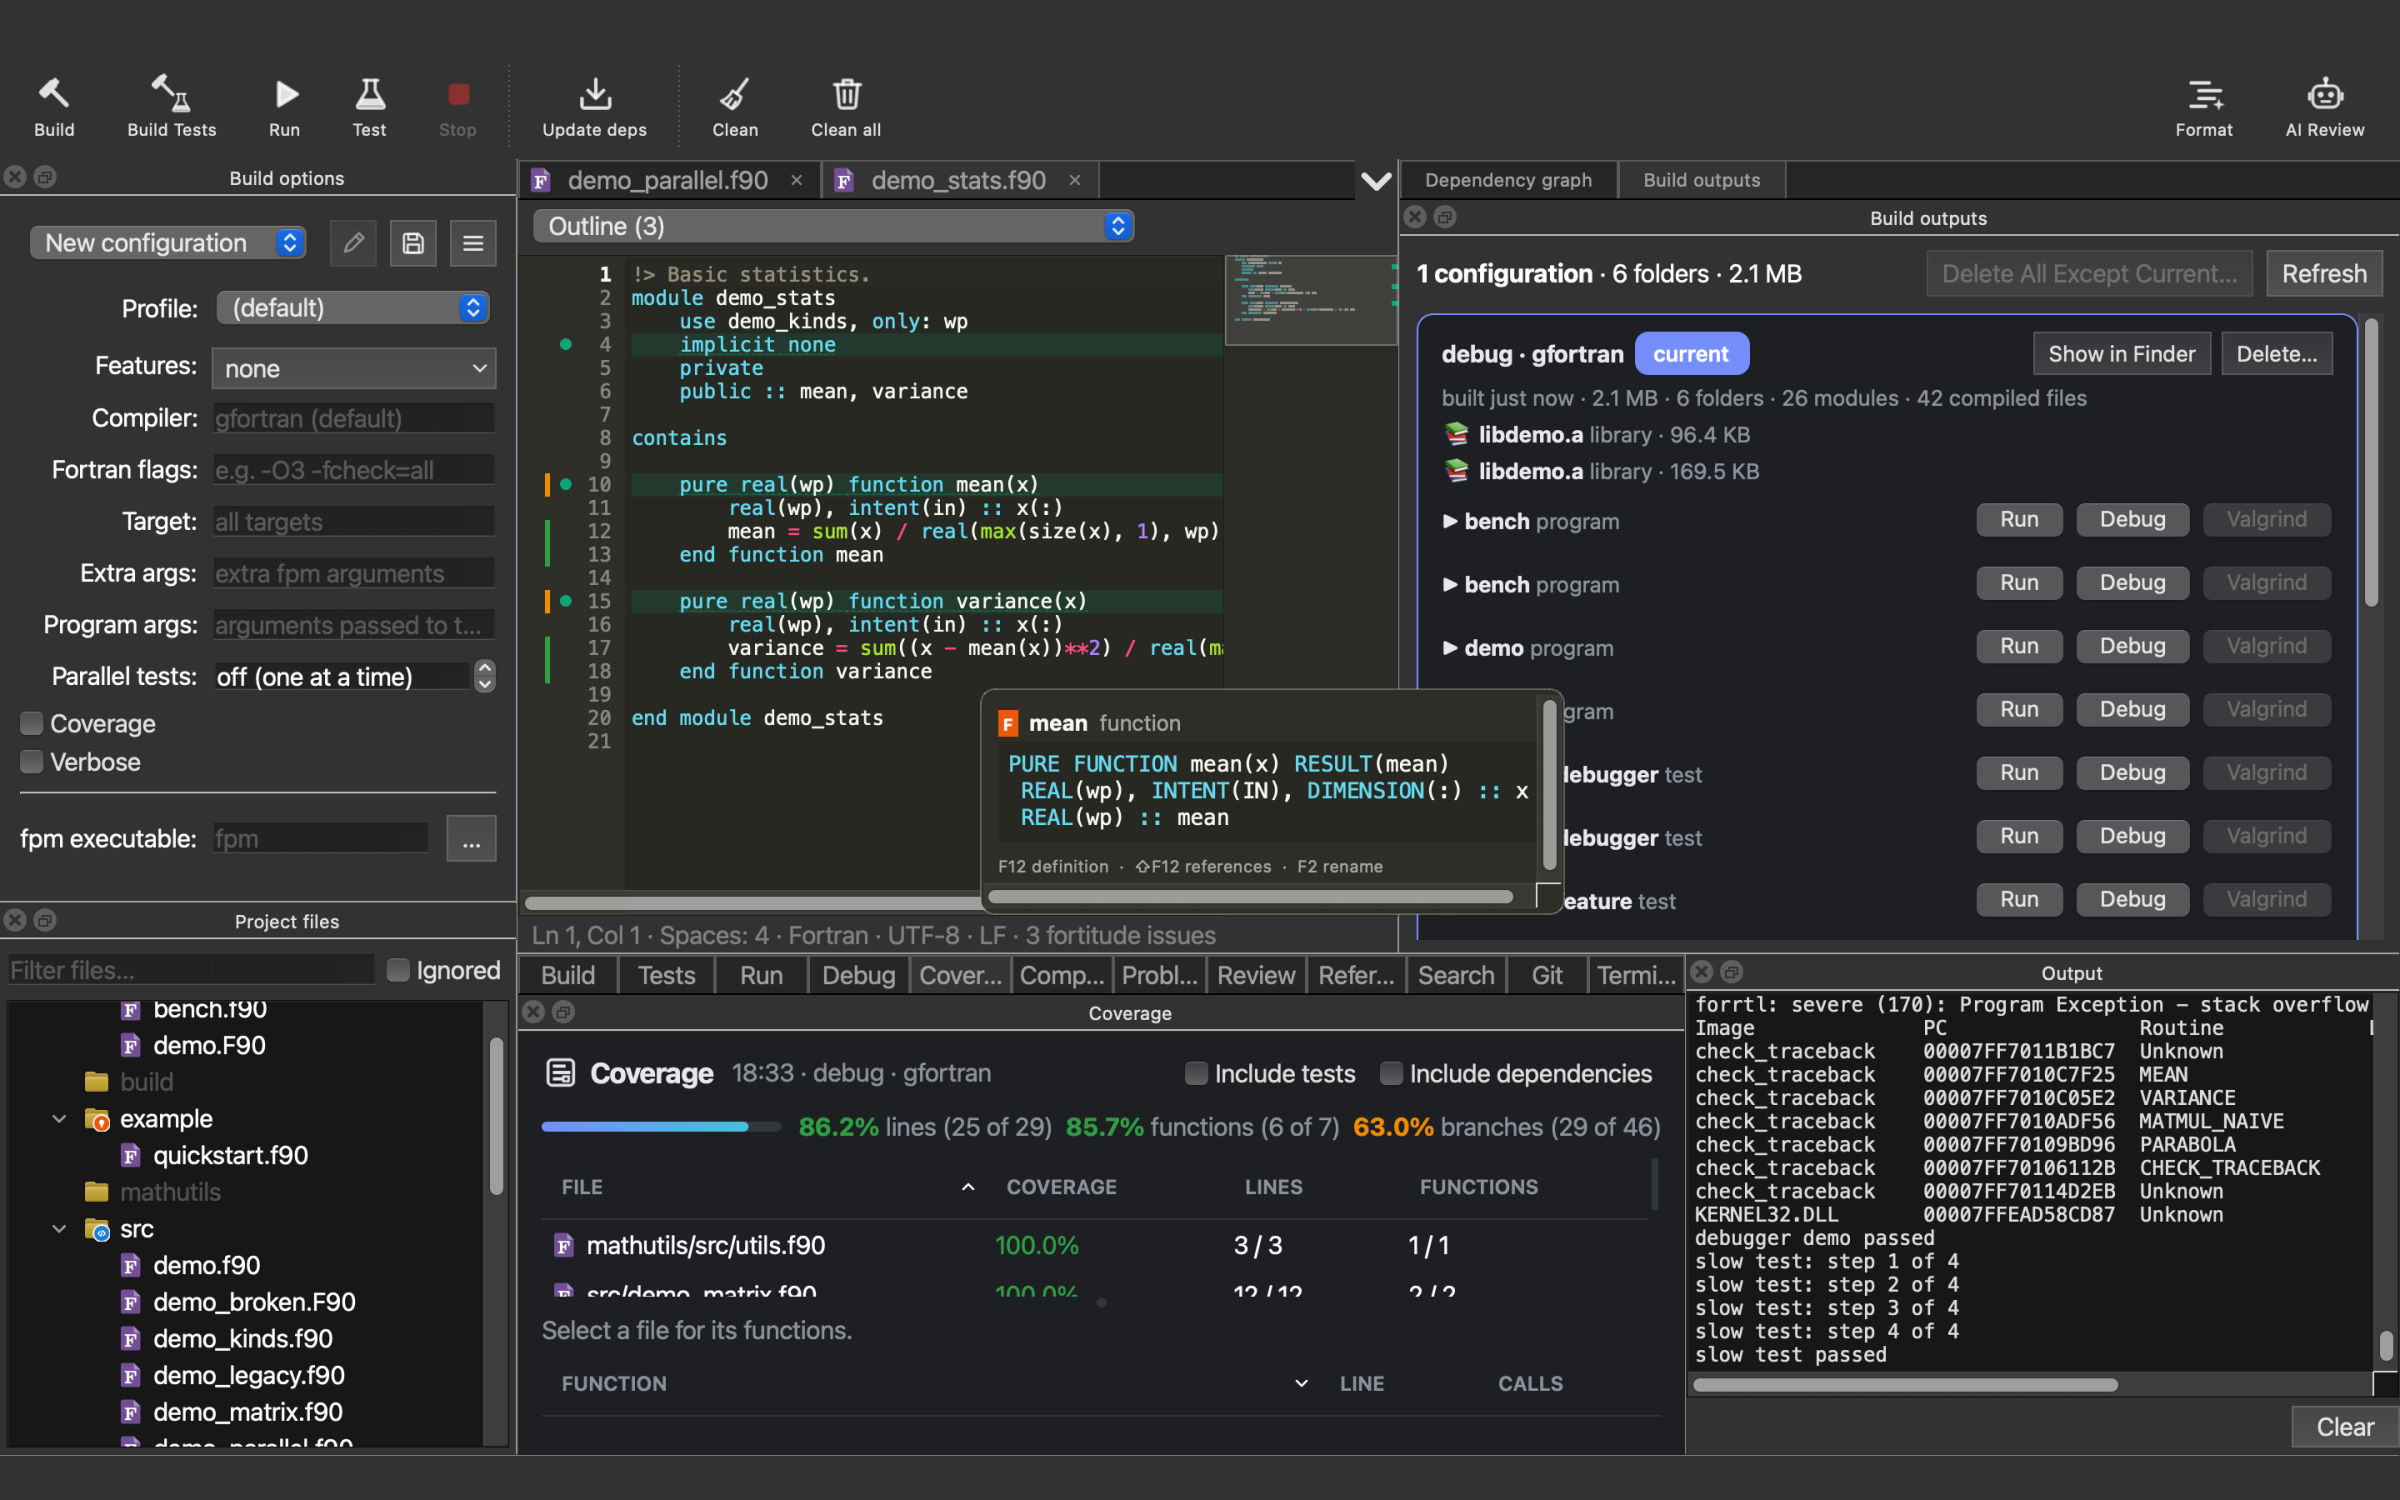
VibeFPMGUI is a graphical front end for the Fortran Package Manager. Build, run, test and debug with live progress, explore your dependencies as a graph, and edit Fortran with a language server, linting, formatting, git, coverage and complexity metrics — and an AI assistant that runs entirely on your machine.
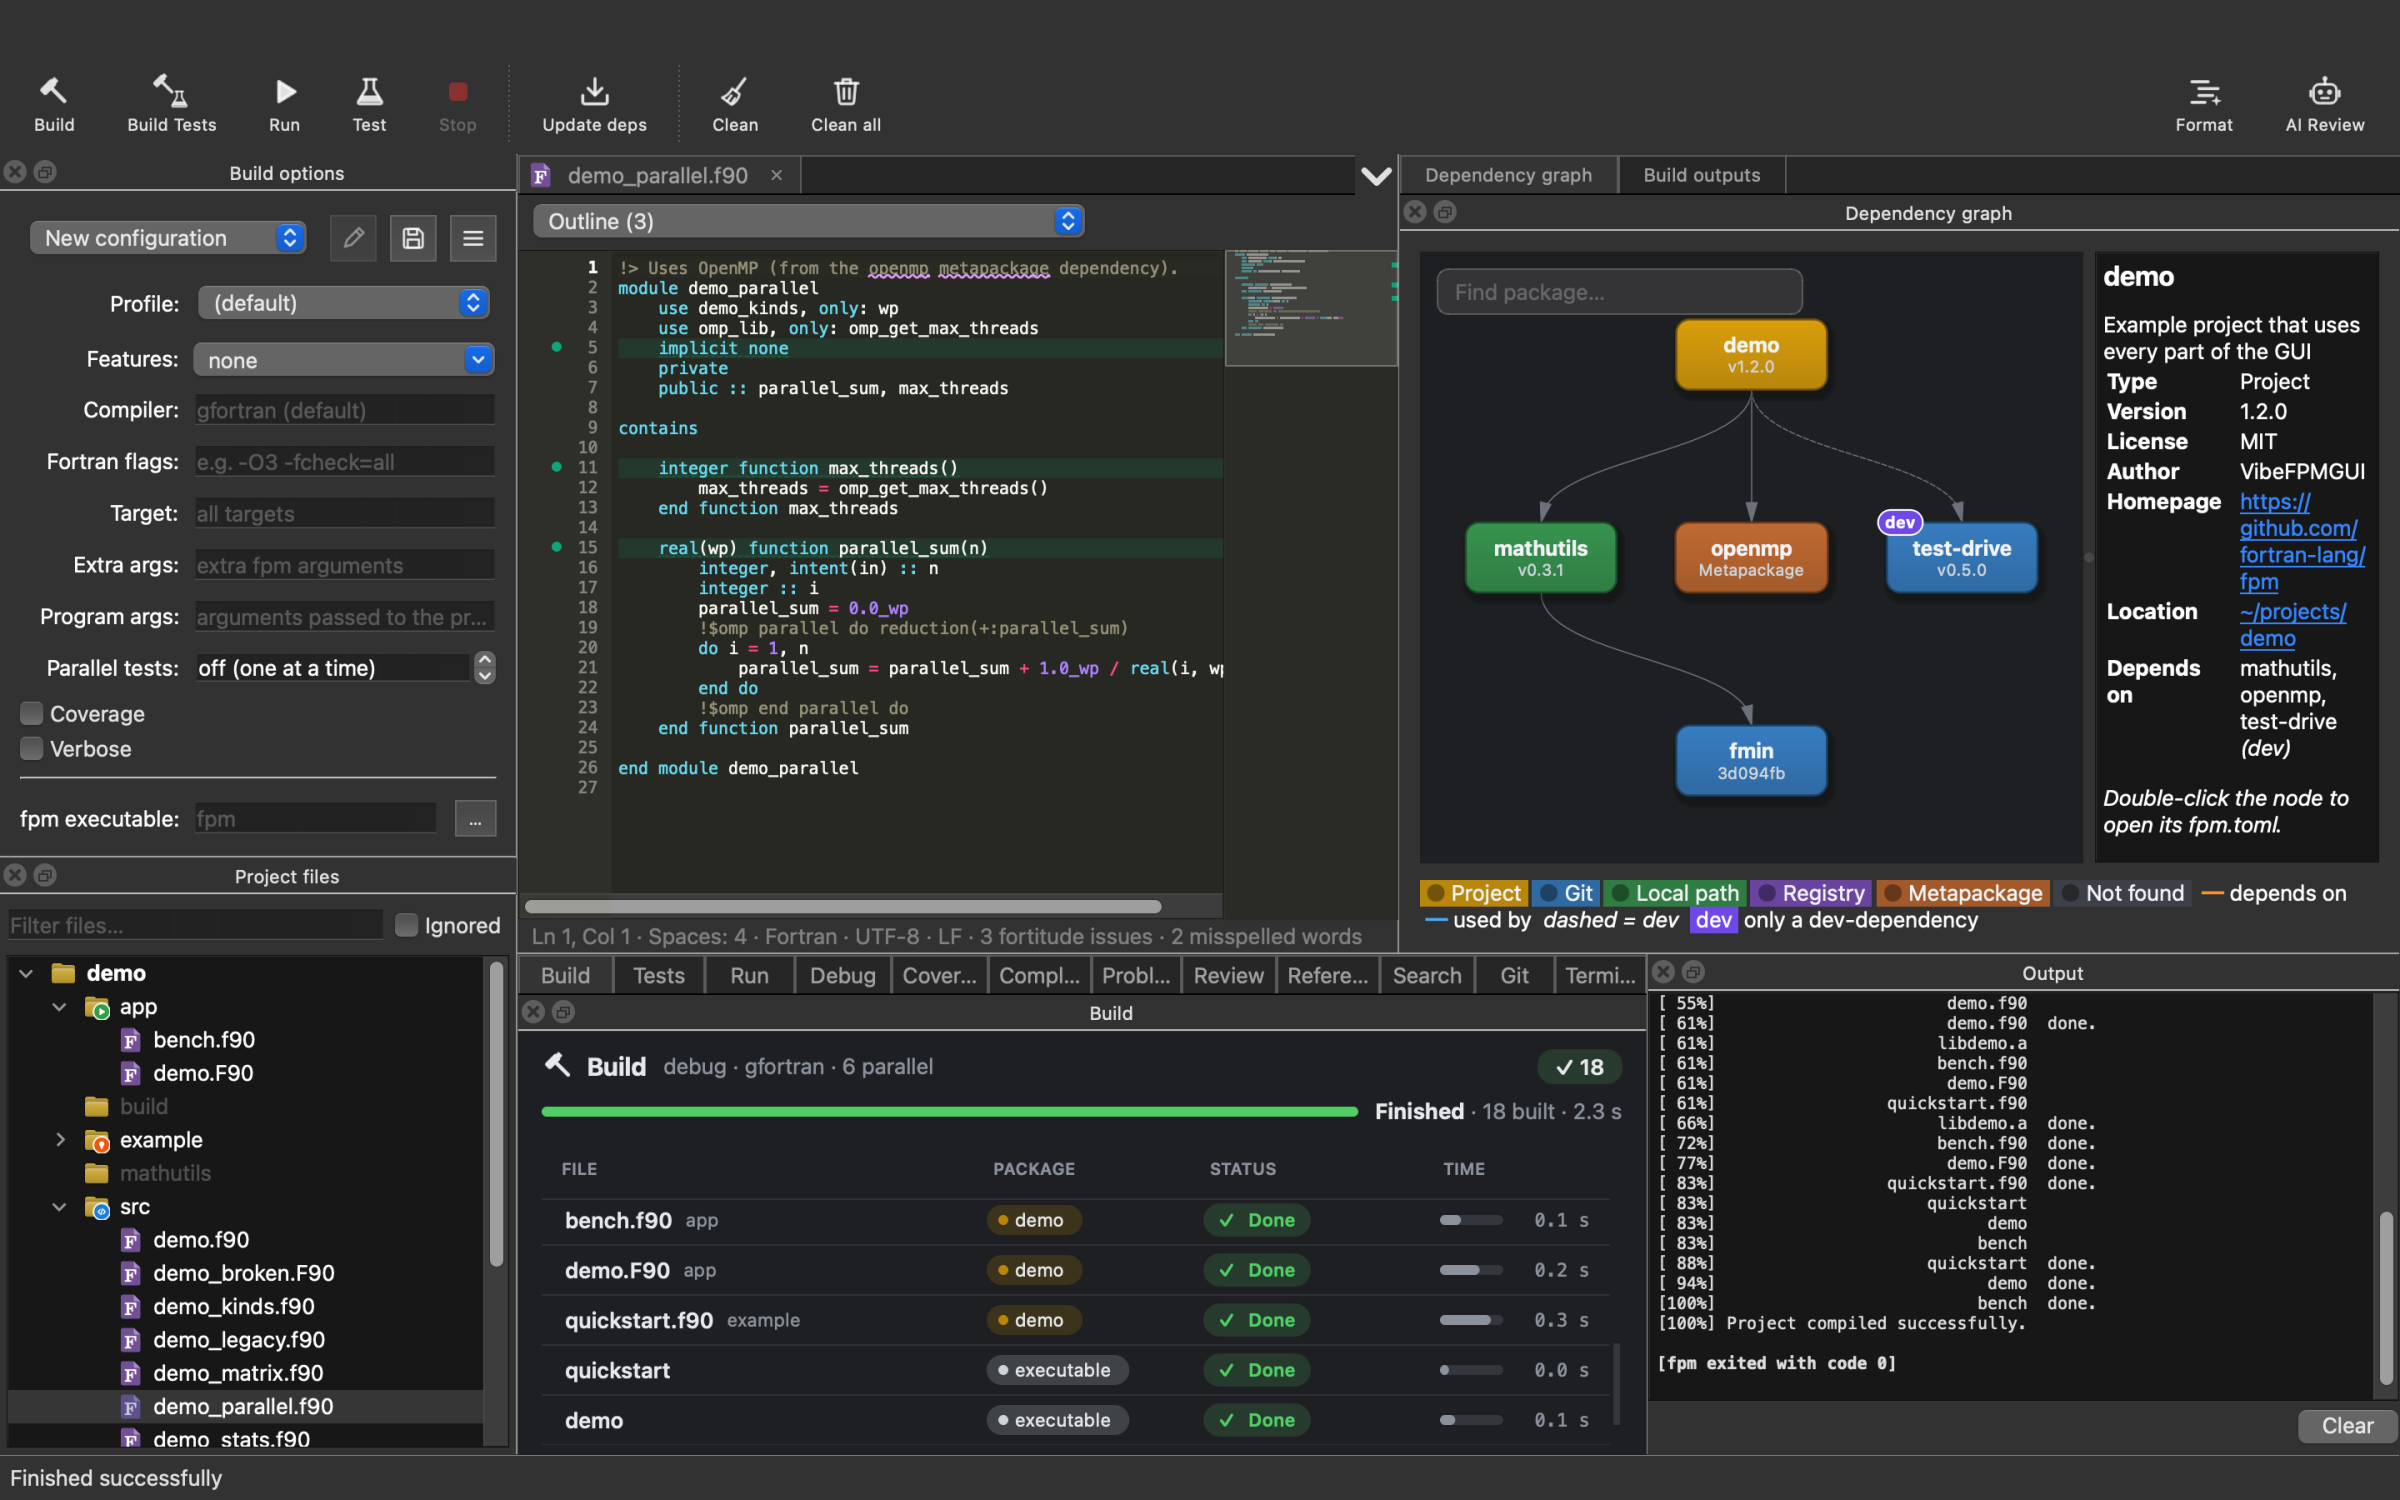
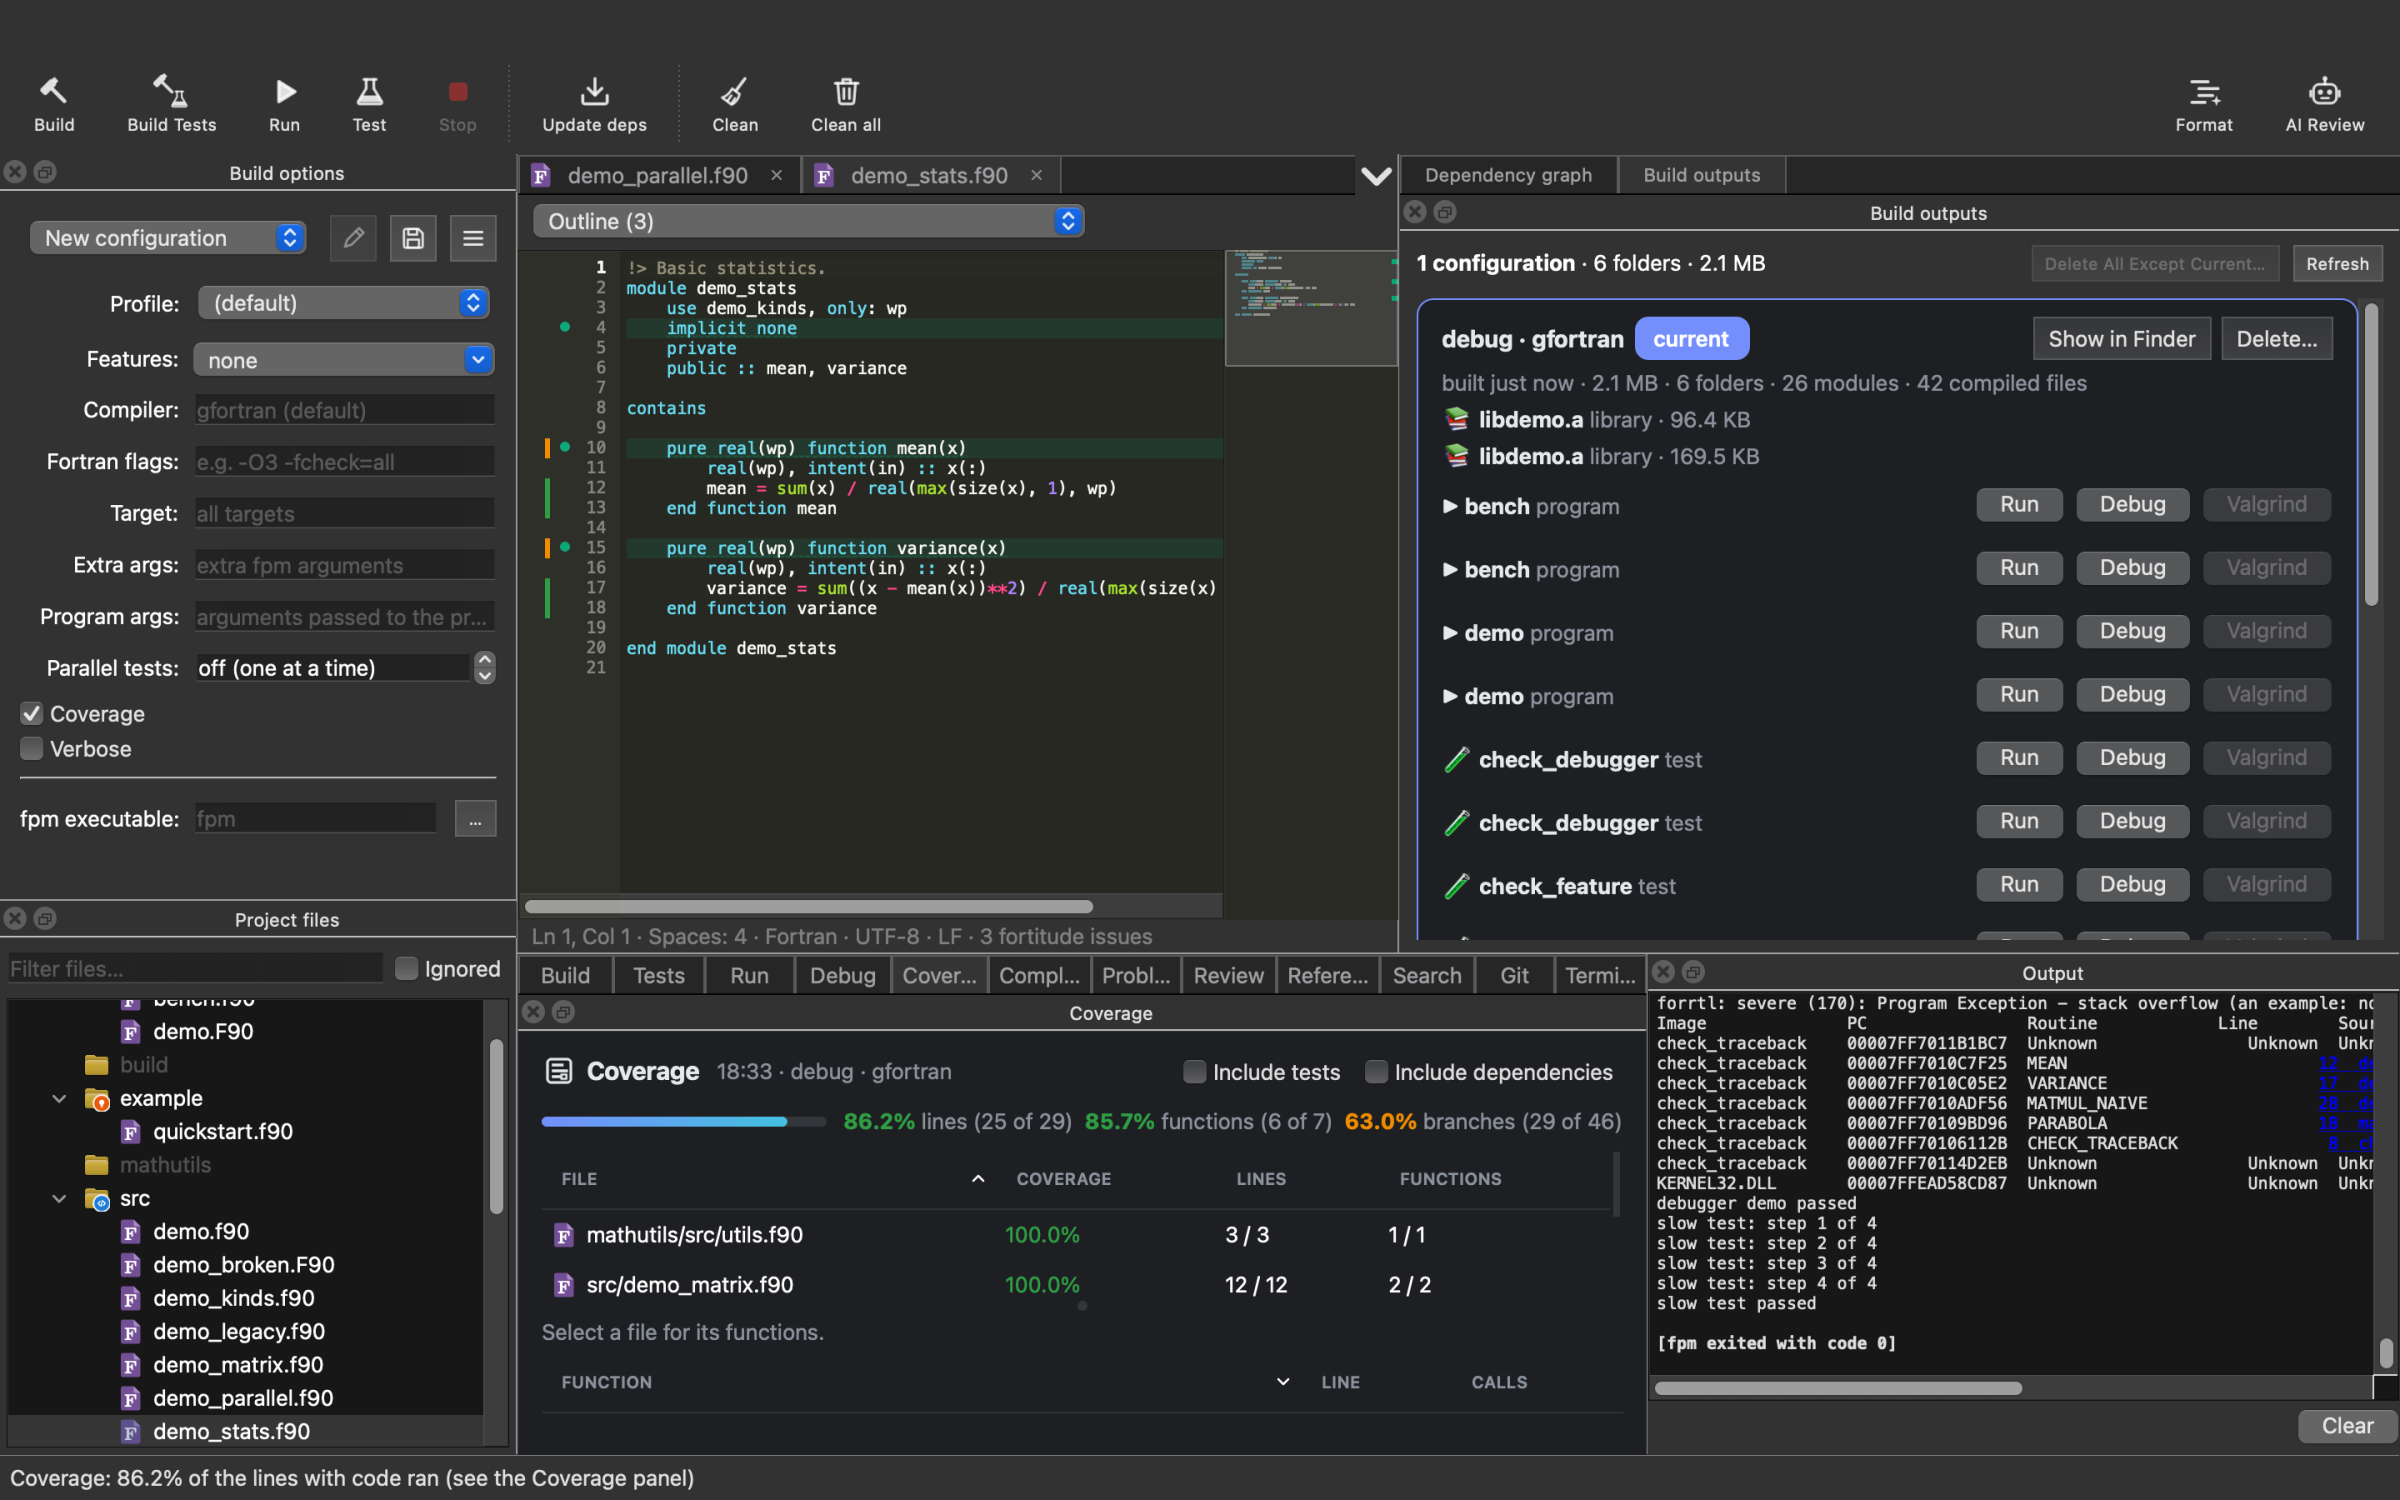
The VibeFPMGUI main window: build options, project files, an open source file, the dependency graph, the build progress grid and fpm's output

Everything fpm does, at a glance

One window for the whole loop: open a project, build, test, debug, read the messages, fix the code, commit, repeat. Every panel docks where you want it.

🔨

Live builds

Every file fpm compiles, in parallel, with its package, status and time — warnings included.

🧪

Tests & coverage

Each test with pass/fail, time and its own output — several at a time if you like — and line coverage in the gutter.

🐞

Debugger

Breakpoints, stepping, the call stack and variables with gdb — for programs, tests and examples.

🕸️

Dependency graph

Your project and every dependency as an interactive graph, with layouts, themes and update checks.

✏️

Built-in editor

Syntax highlighting, compiler markers, multi-row tabs, a command palette, find and replace across the project.

🧭

Language server

Hover docs, go to definition, completion, argument hints, references and rename, via fortls.

🧹

Lint & format

fortitude checks your code as you type, with one-click fixes; fprettify tidies it.

🌿

Git

What changed, staged and untracked, with side-by-side diffs of each file.

📈

Complexity

Size and complexity of every procedure, and its control-flow graph.

⌨️

Terminal

A shell in the project's folder, with the app's environment — fpm and the compilers on hand.

🗂️

Build configurations

Named sets of build options in vibefpm.json, beside fpm.toml, to share with your team.

🤖

Local AI

Reviews, a chat about your code, explanations and fixes — from a model on your own computer, with Ollama.

Build

Watch every file compile

Run fpm build, run, test, update and clean from the toolbar — or Build Tests, to compile the tests without running them — with the usual options: profile, compiler, flags, features, target and arguments. Hover an option to see the fpm flag it becomes.
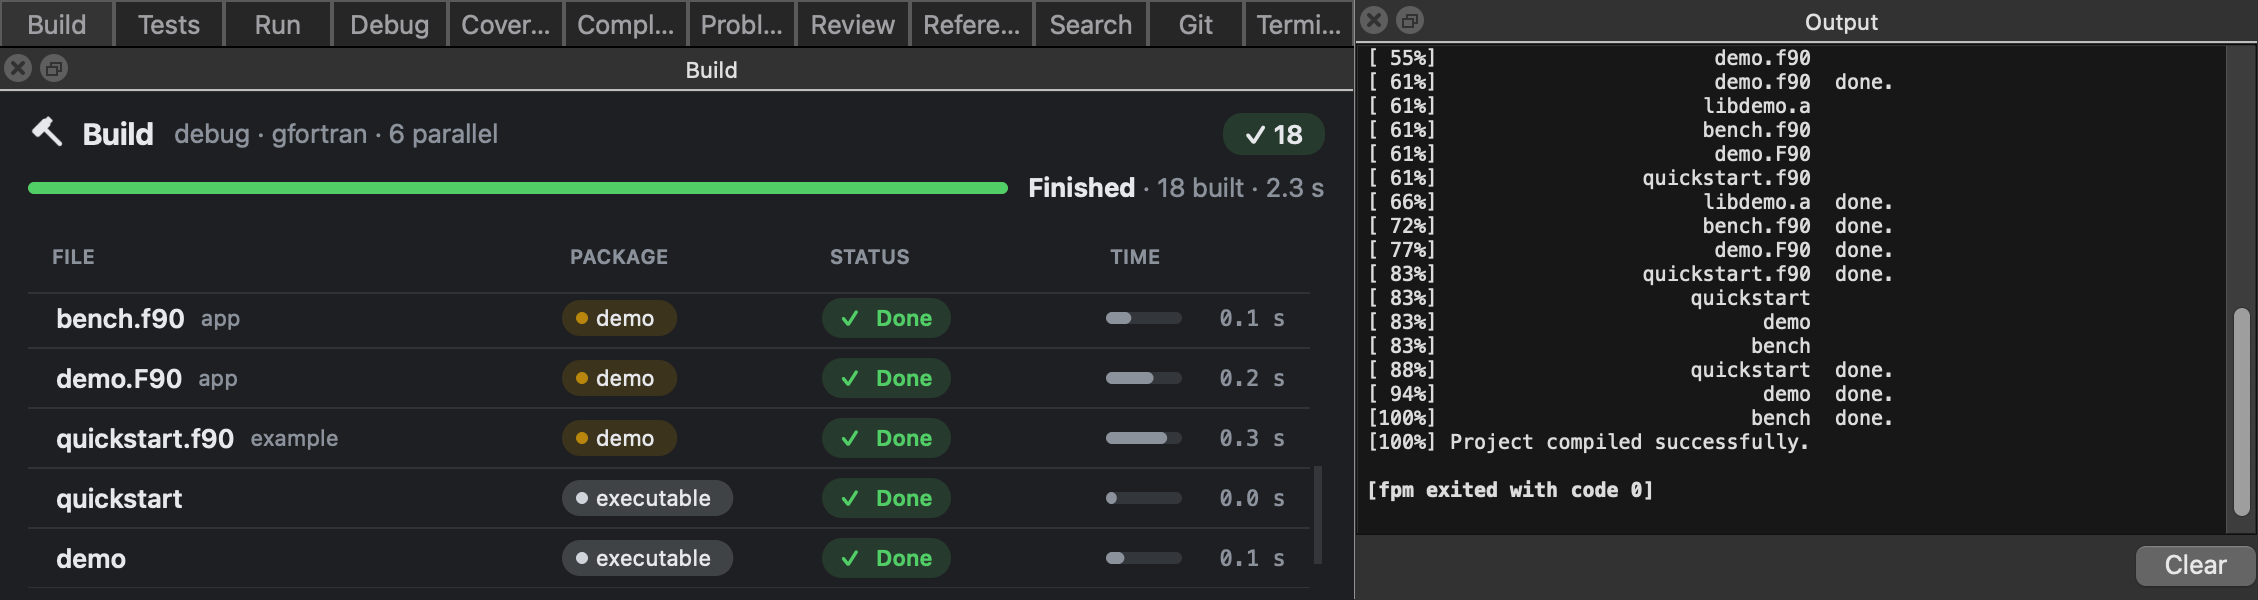
  • A live grid of every file and target fpm compiles — parallel and OpenMP builds included — with status, package (dependencies too, even those fpm downloads as it builds) and time, plus overall progress.
  • Warnings come from fpm's per-file compiler logs, so you see them even when the build succeeds. gfortran, gcc/clang, Intel and lfortran messages are understood.
  • Double-click a row to open the source at the first message; file locations in the output are links.
  • Colored compiler output is shown in color, and runaway output can't freeze the app.
The Build panel: a grid of compiled files with package, status and time next to fpm's output

Build configurations

Name your build settings, and share them

Save the Build options as named configurations — “gfortran debug”, “release”, “ci” — in a vibefpm.json beside the project's fpm.toml, so they can be committed with it.
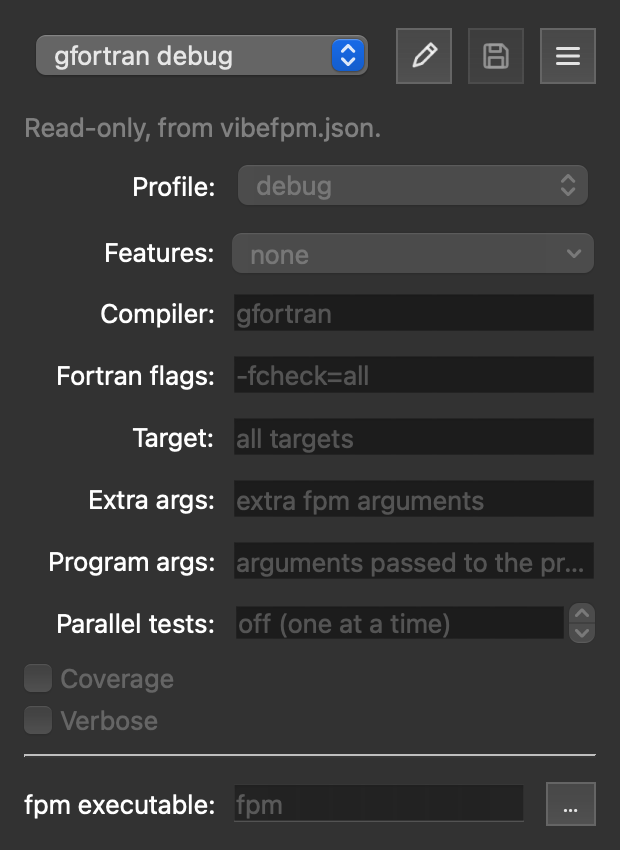
  • Choose one from the list at the top of Build options; it's shown read-only until you Edit it.
  • Save under its own name or another, edit a copy, delete, or open another configuration file.
  • The same file keeps the project's GUI options and open tabs; File → Projects opens a project by its folder.
  • The window title says which project and configuration you're on.
Build options with the configuration gfortran debug chosen: profile debug, compiler gfortran, flags -fcheck=all, read-only

Test, run & coverage

Tests you can follow

Test builds, lists the tests, then runs each one through a small wrapper so its start, end and exit code are known — even with your own --runner such as mpirun.
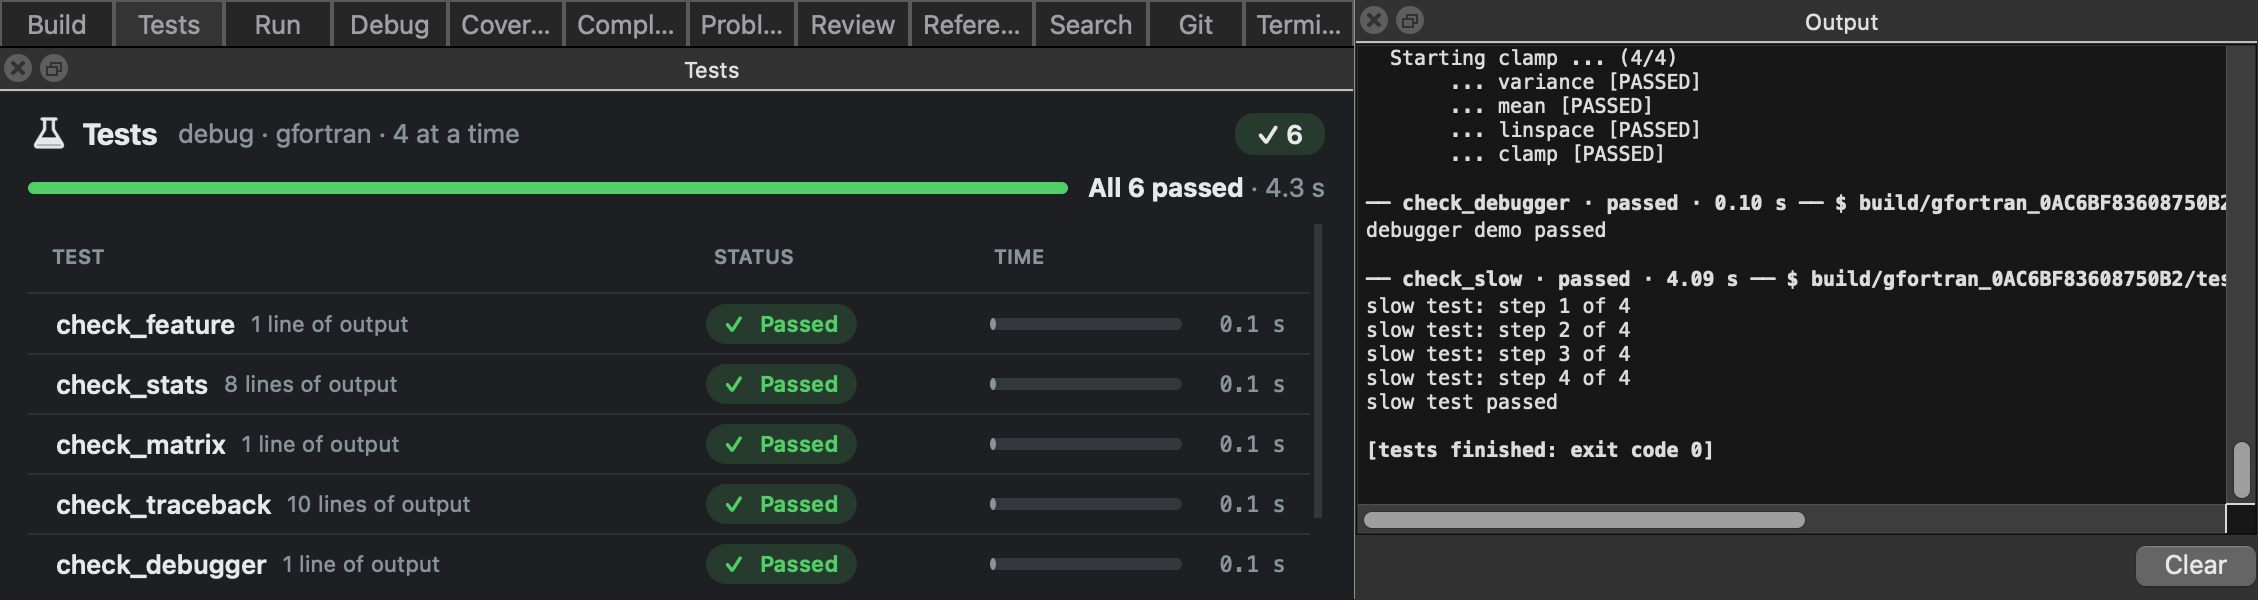
  • Every test as queued, running, passed or failed, with its time and a progress bar — one at a time, or several at once.
  • Run times are remembered, so later runs estimate the time left. Click a test to see only its output.
  • Tick Coverage and the editor's gutter shows which lines the tests ran; the Coverage panel has the totals and each file's missed lines.
  • Run works the same way for programs; right-click one to debug it.
The Tests panel with every test passed and their output
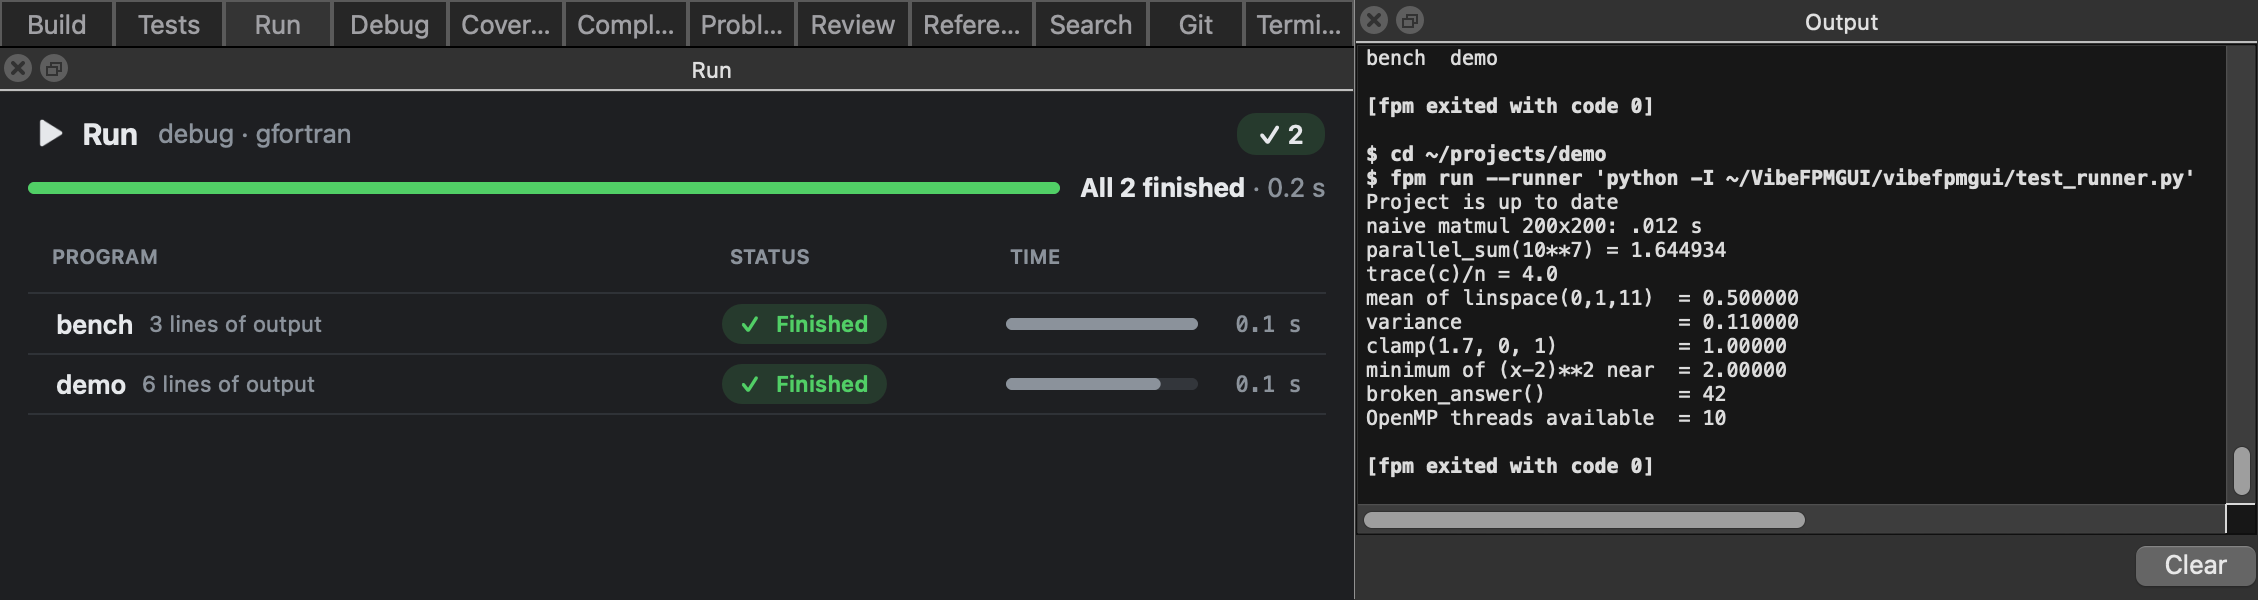
The Run panel with the finished programs
Coverage: bars in the editor's gutter and the Coverage panel's totals per file
Build options → Coverage, then Test: bars in the gutter, totals in the Coverage panel

Debugging

Stop at a line, and look around

Click left of a line number for a breakpoint, press F5, and the program — or a test, or an example — is built with debug information and runs under gdb, through its Debug Adapter Protocol.
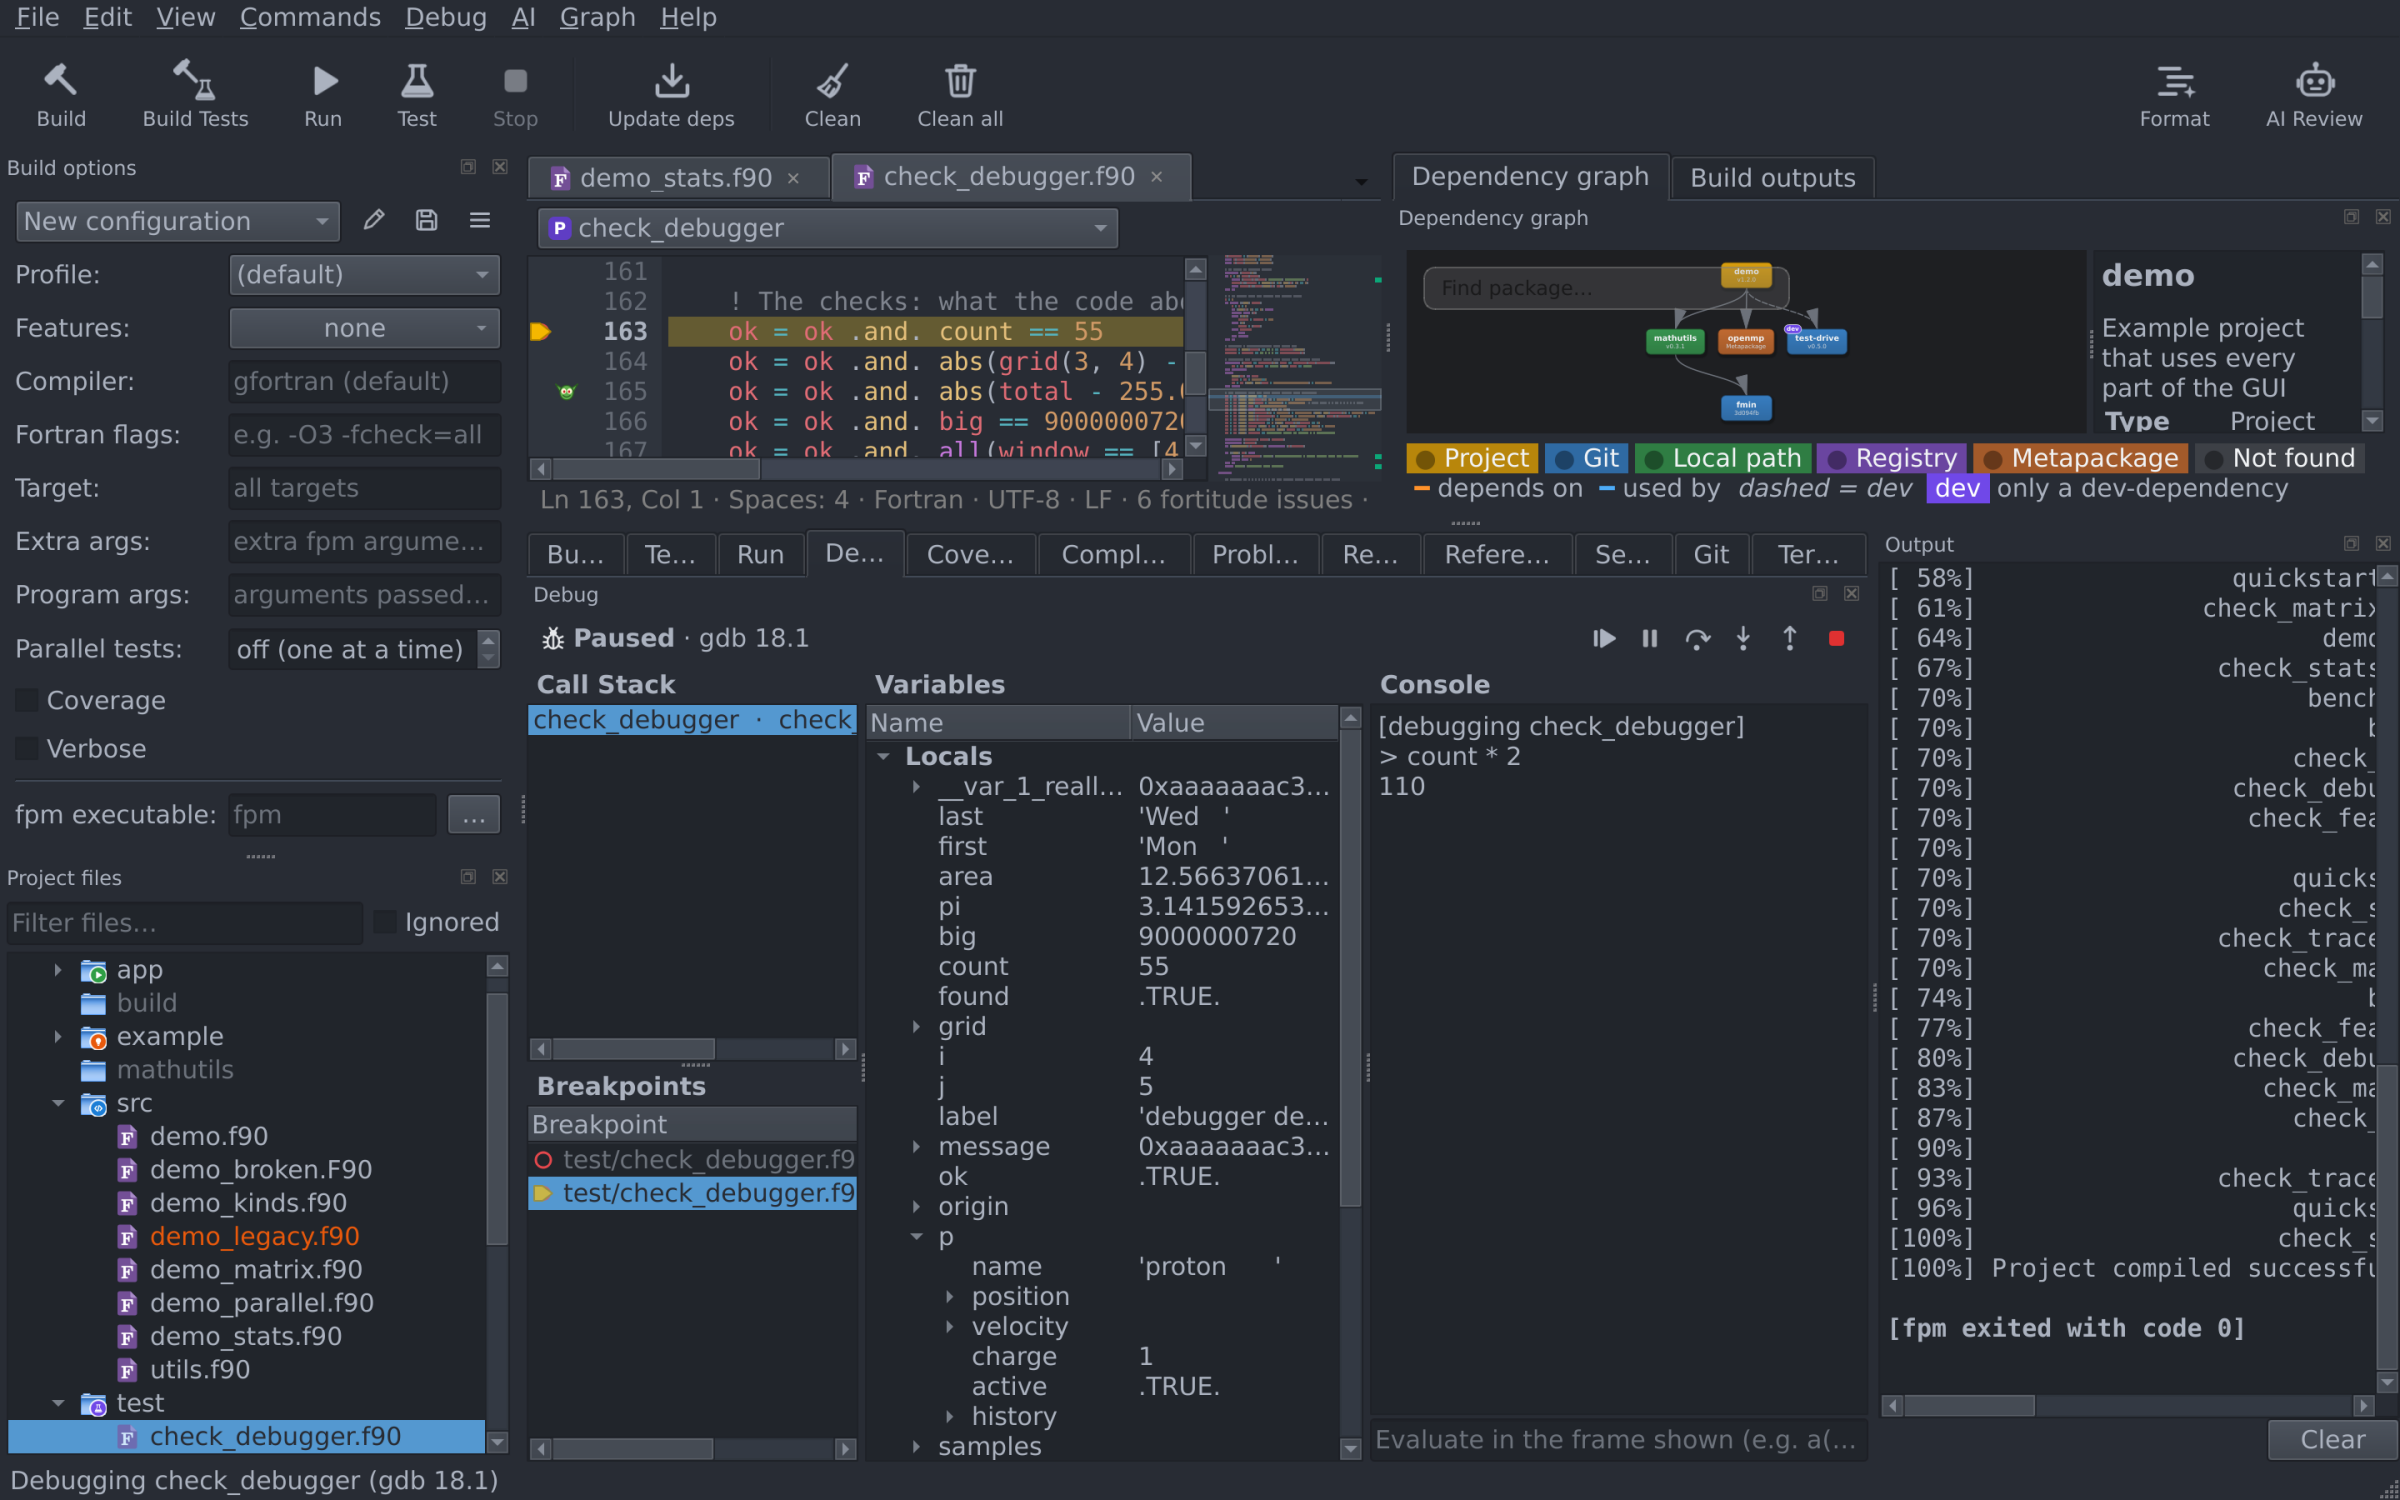
Stopped at a breakpoint in check_debugger.f90: the yellow arrow at the line, the Debug panel with the call stack, the breakpoints list, the variables with a derived type expanded, and the console
  • Step over, into and out of procedures; continue; pause; stop — from the Debug panel's buttons or the keys.
  • The call stack (click a frame to go there) and the variables: arrays and derived types expand, module variables included.
  • Evaluate any expression in the frame shown — a(2:3), p%x — with a history.
  • The breakpoints list shows every breakpoint in the project: enabled, disabled (hollow) or not placed, with its code; the one you're stopped at is marked.
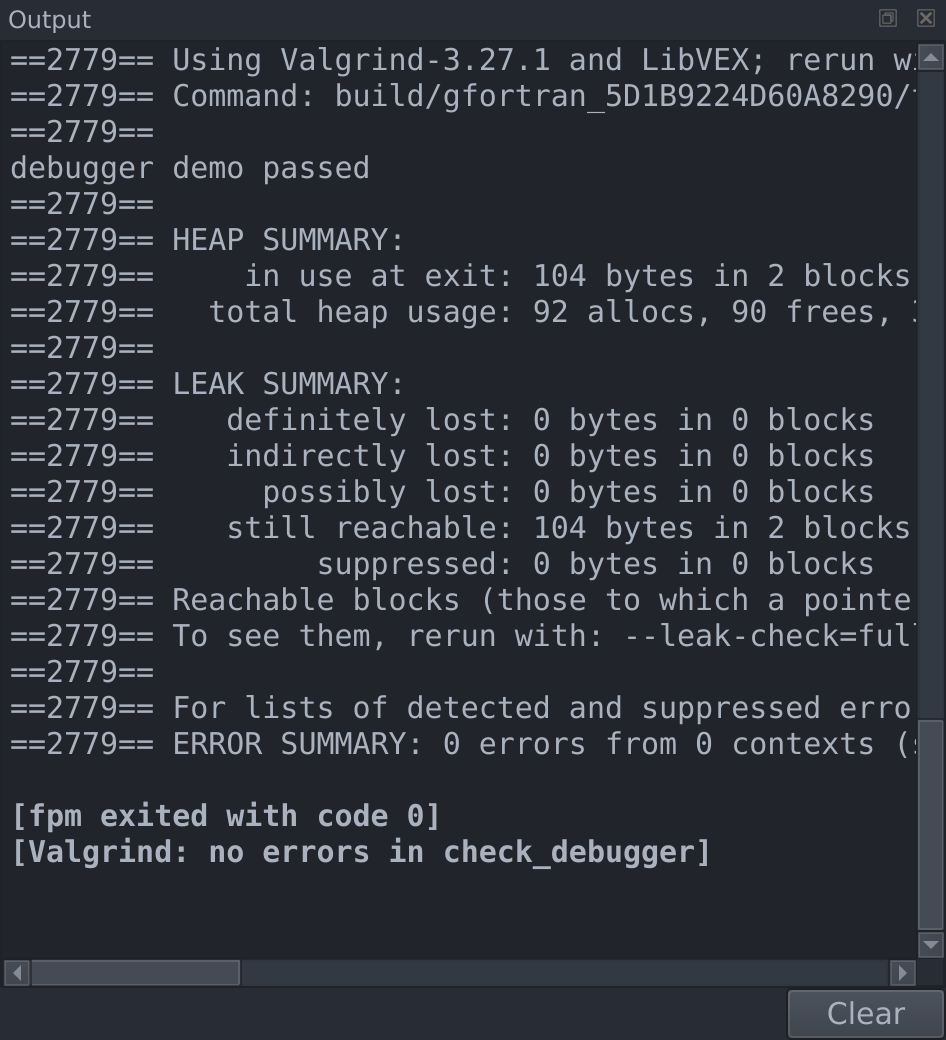
Valgrind's memory check of a test in the Output panel, from the Build outputs panel's Valgrind button
Build outputs → Valgrind

Memory checks with Valgrind

On Linux, the Valgrind button beside each program, test and example runs it under Valgrind's memory check through fpm's --runner: leaks and invalid reads and writes, each with its file and line.

Dependencies

See how it all fits together

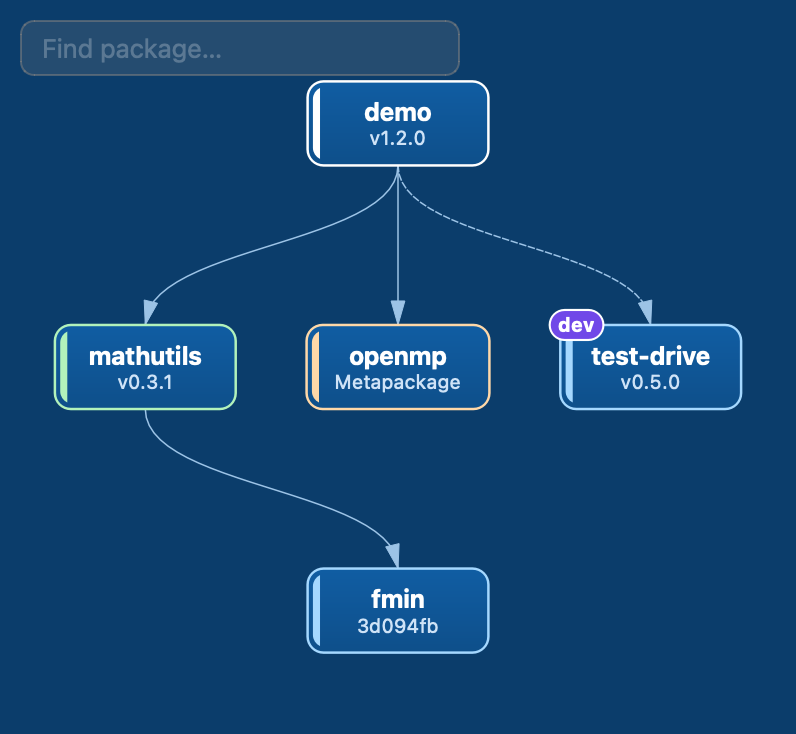
The dependency diagram is built from your fpm.toml and those of every downloaded dependency — git, local path, registry and metapackages, each with the tag, branch or version it's pinned to.
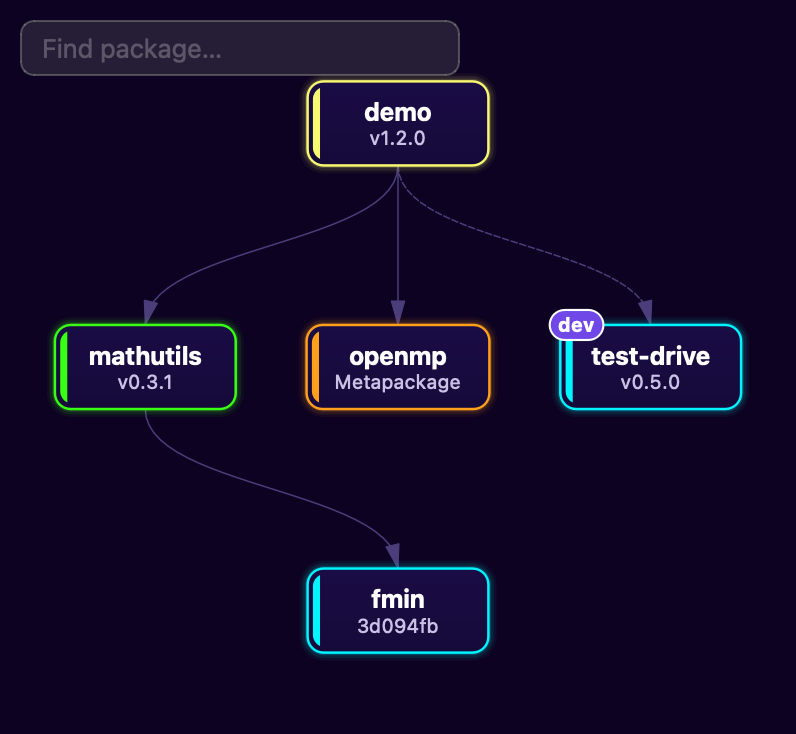
  • Layered, radial, circular or force-directed layouts; light, dark, blueprint and neon themes.
  • Click a package to highlight what it uses and what uses it; double-click to open its manifest.
  • Git dependencies show the exact commit fpm checked out, linked to GitHub or GitLab. Version conflicts are flagged.
  • Dev-dependencies are badged — and you can show your dependencies' own too.
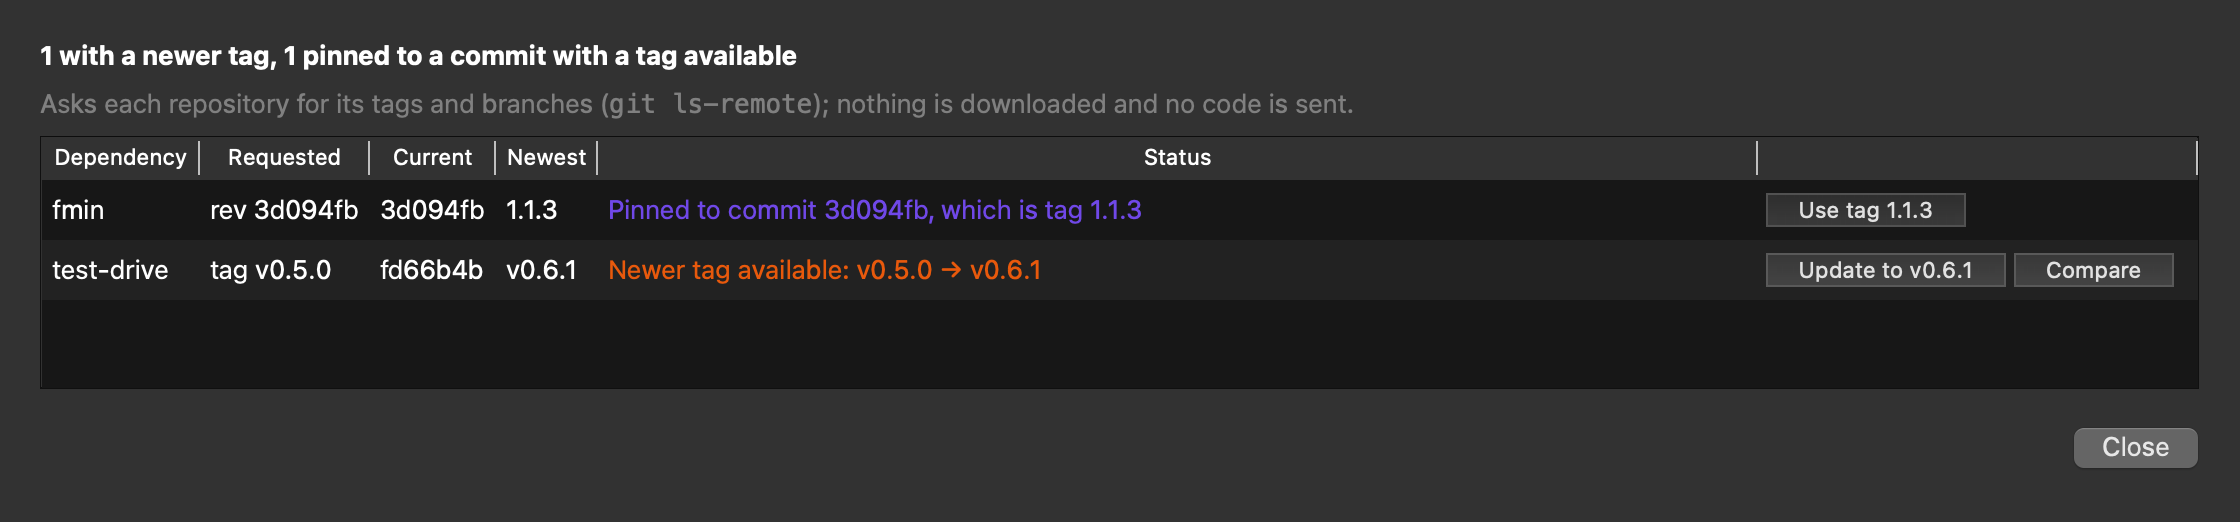
  • Check for Dependency Updates finds newer tags without downloading anything, and updates a pin in place.
The dependency graph in the neon theme
Neon theme
The dependency graph in the blueprint theme
Blueprint theme
The dependency update check: newer tags for the git dependencies
Commands → Check for Dependency Updates…

Project files

Your project, and everything it pulls in

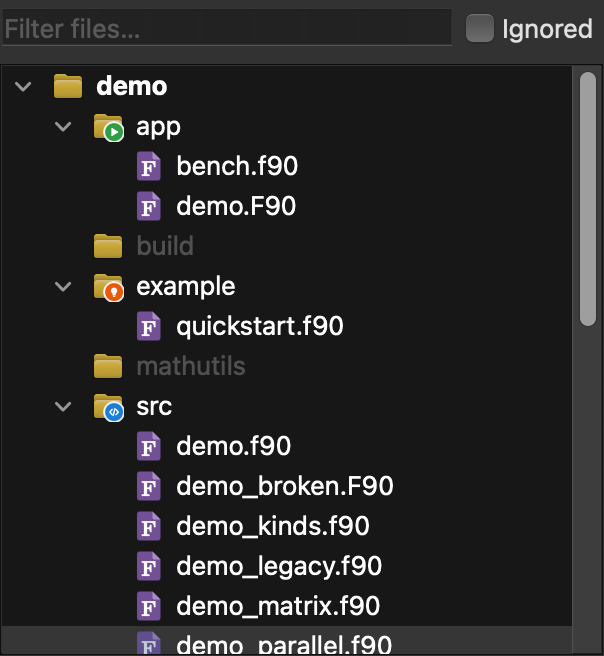
The file tree lists the project and each dependency, with fpm's folders badged — library sources, programs, tests, examples, include files. One click previews a file; double-click keeps it open.

  • Hidden, generated and git-ignored files are greyed out, with the responsible .gitignore line.
  • A fast filter, even on projects with tens of thousands of files.
  • Files with errors or warnings from the last build show in red or orange.
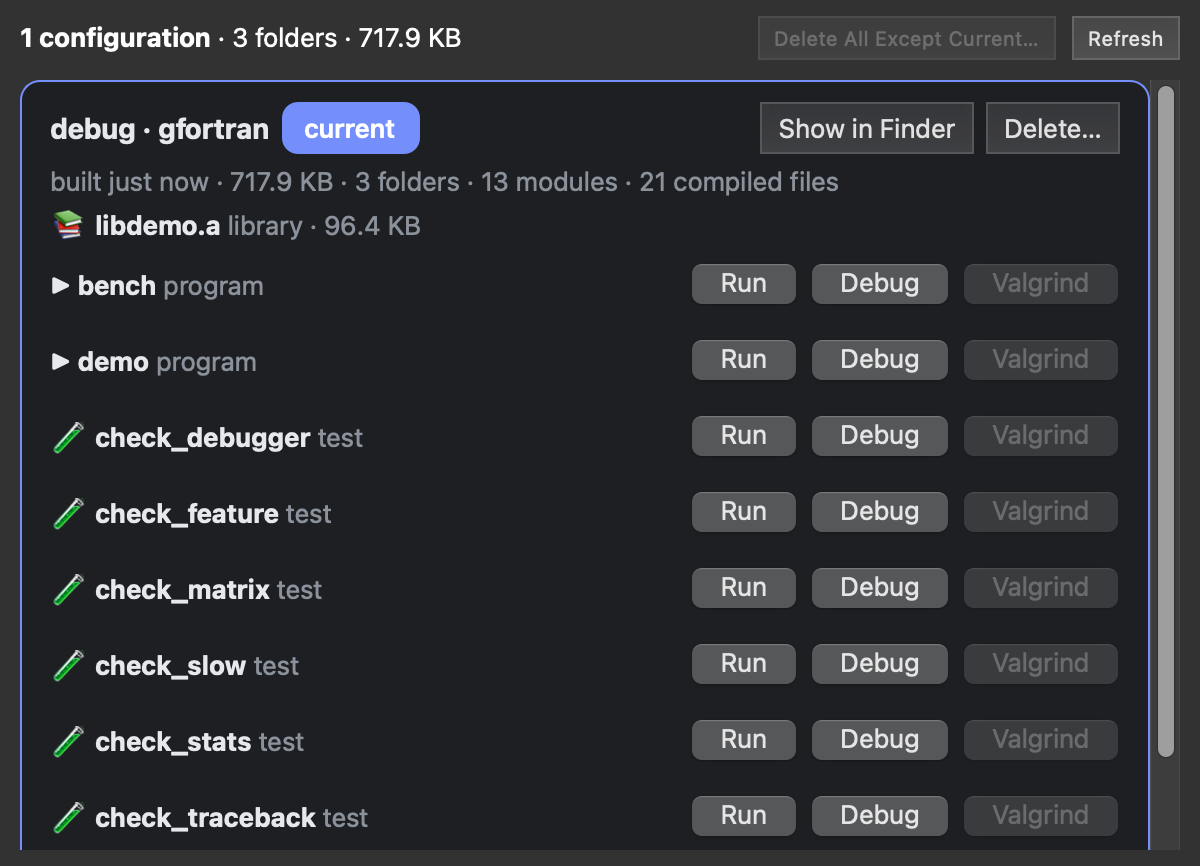
  • The Build outputs panel shows every build configuration fpm has kept, with its programs, tests and examples ready to run, debug or check with Valgrind — and a way to free the space.
  • File → New fpm Project… makes a new project with fpm new.
The project files tree with badged fpm folders
The Build outputs panel: a configuration with its library, programs, tests and examples, each with Run, Debug and Valgrind buttons

Editor

A Fortran editor that knows your code

Double-click a file — or a row in the build grid — and it opens in the built-in editor, with the build's warnings and errors in the gutter. Open tabs, cursor positions and the file tree are remembered per project, and big files stay quick.
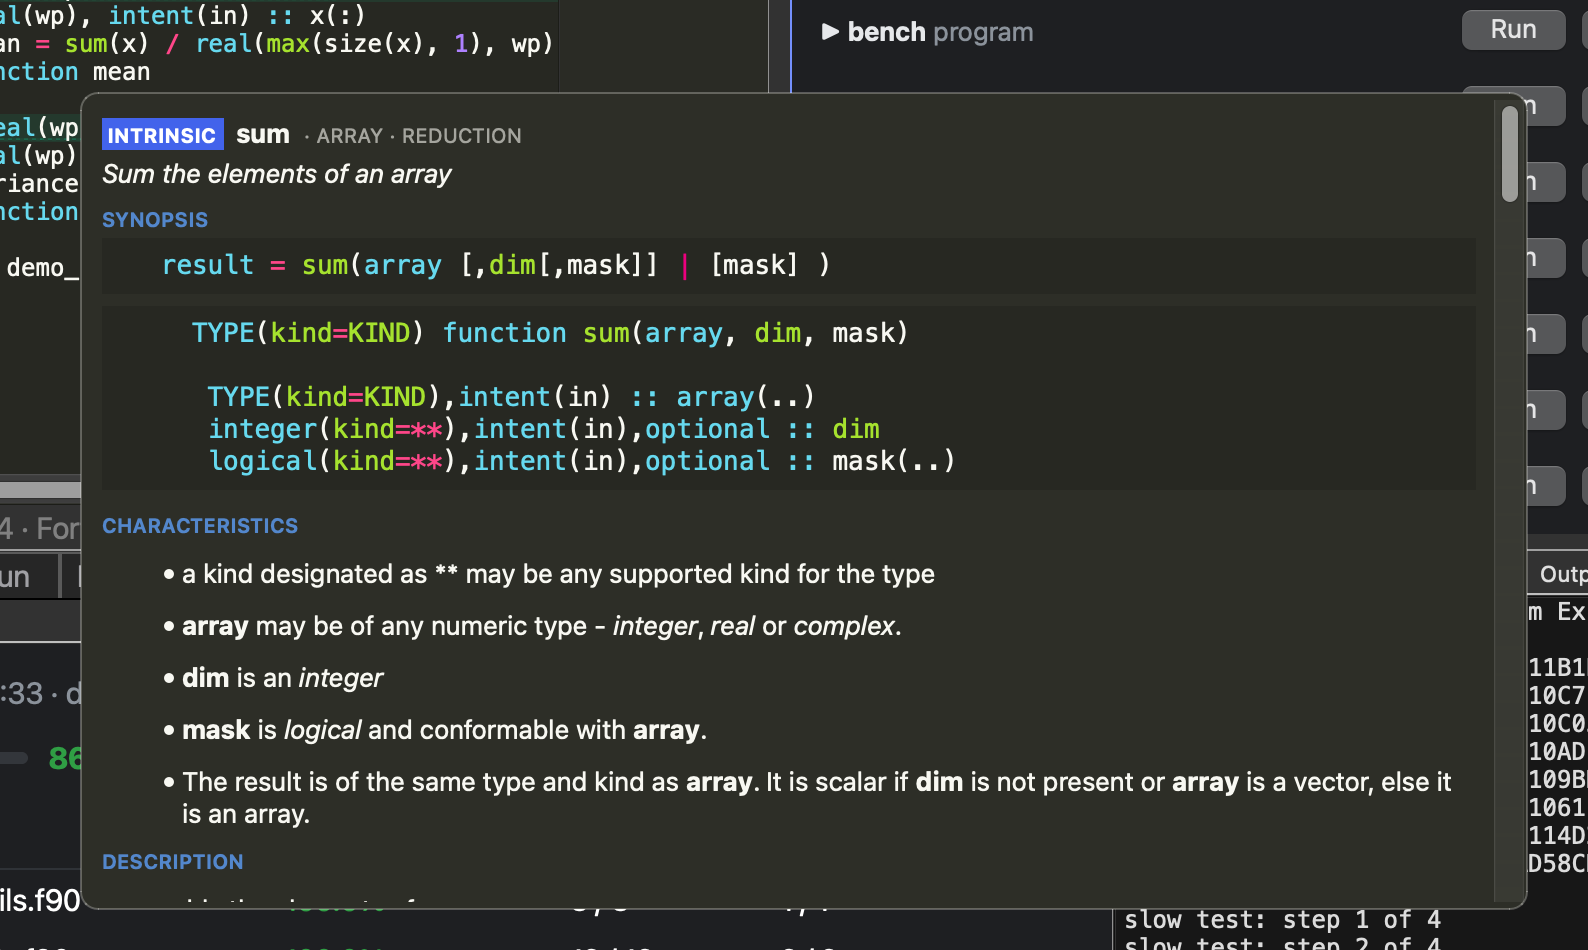
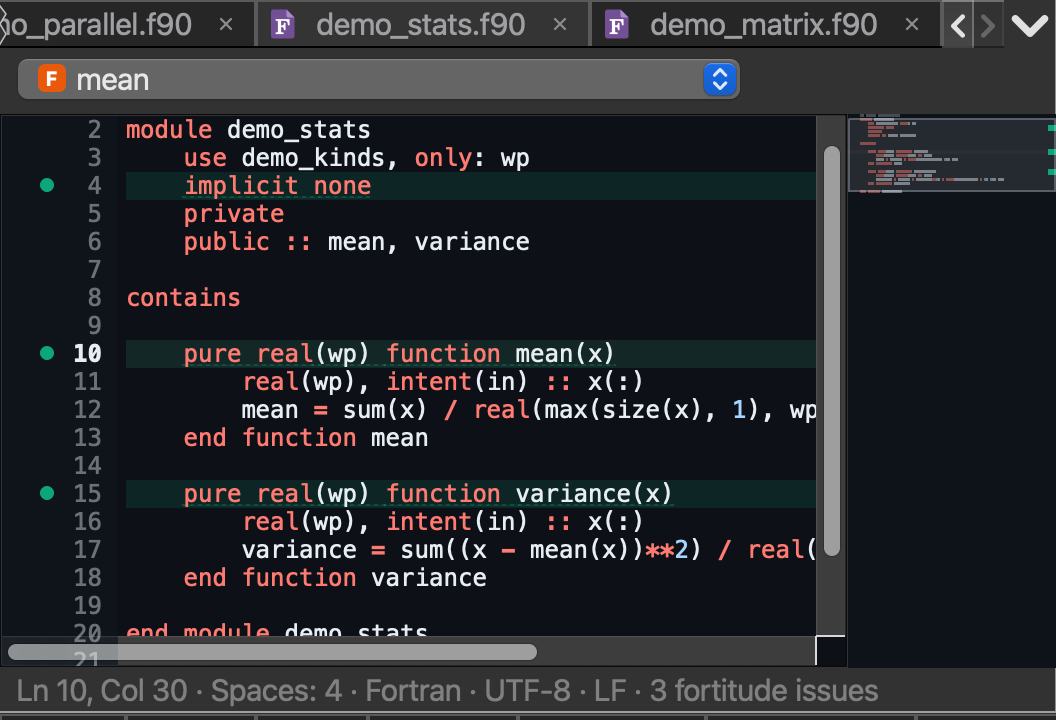
The editor with a hover card for the function mean, showing its declaration
A hover card for the intrinsic sum with its manual page

Hover cards

Rest on a name for its declaration and doc comment. Intrinsics get their full manual page, rendered, with a badge and their category.
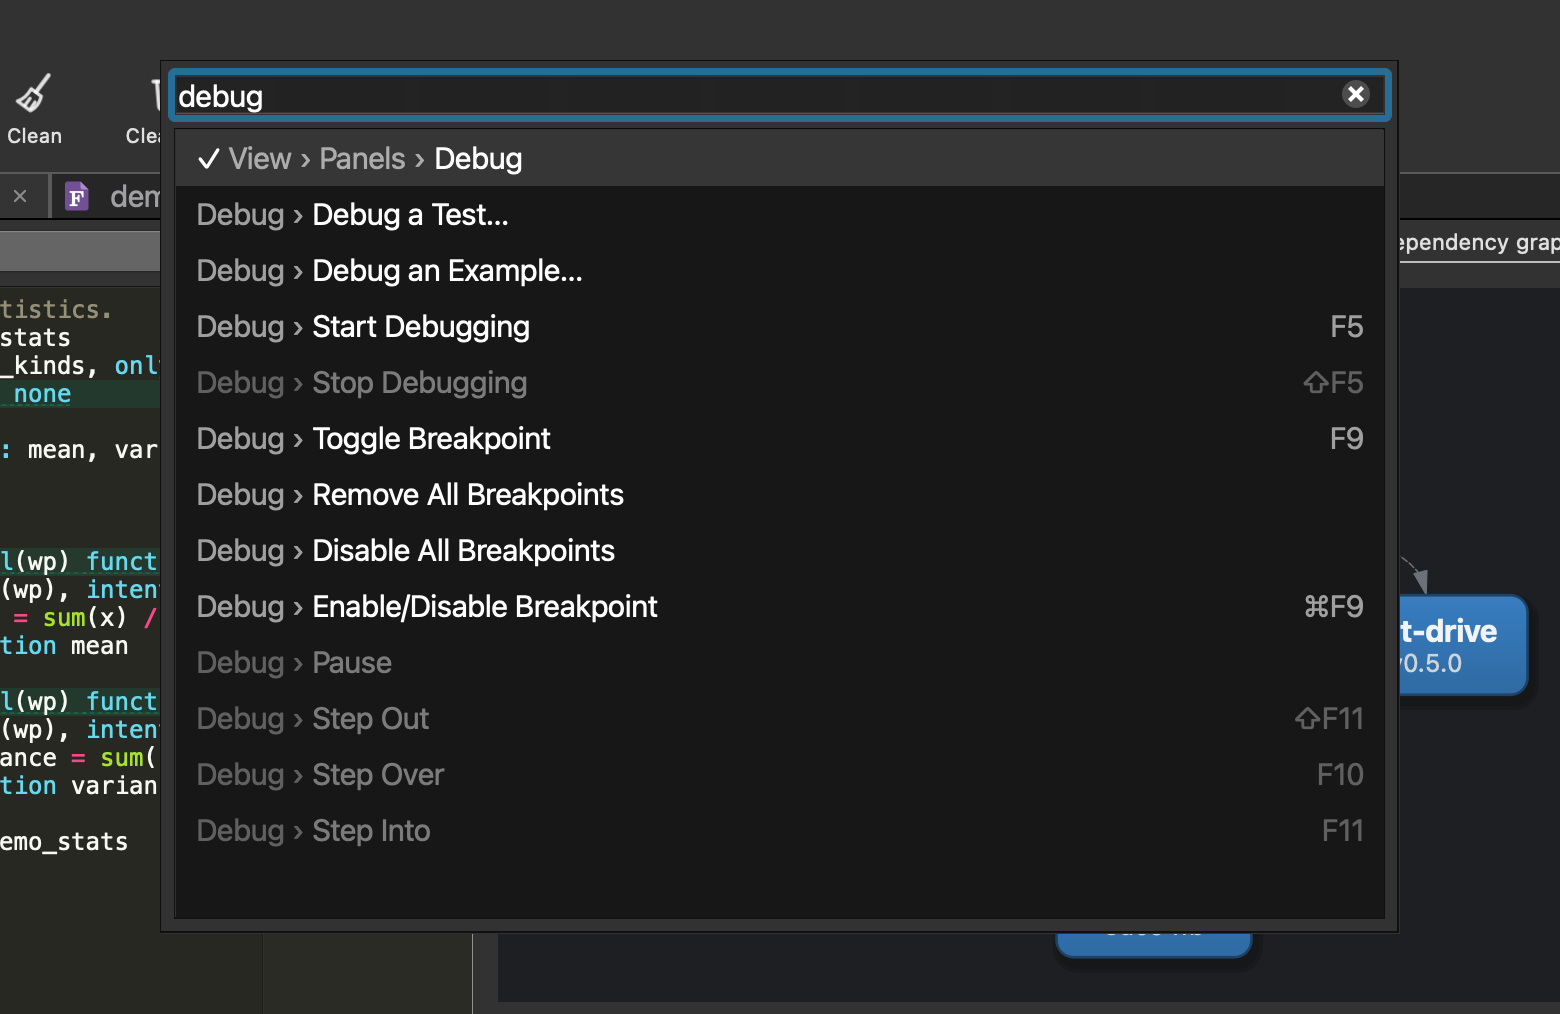
The command palette finding the debugging commands

Command palette

⌘⇧P (Ctrl+Shift+P) finds any command in the menus by typing part of its name. Tabs can wrap onto several rows; lines can be commented, moved, sorted and re-cased from the Edit menu.
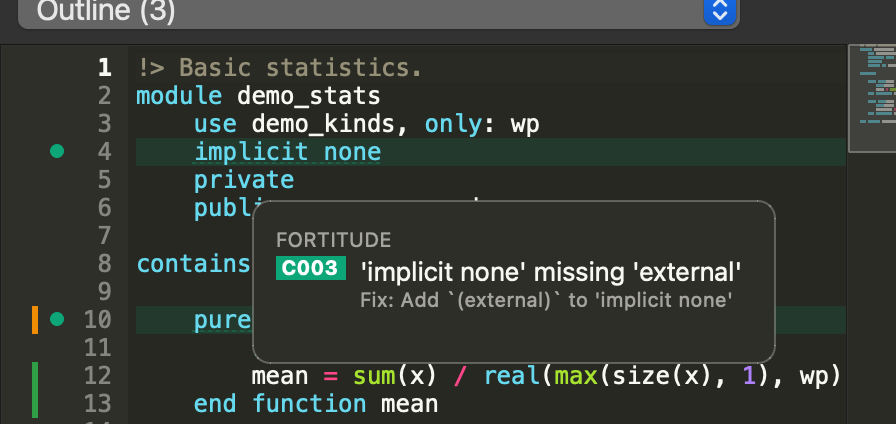
A fortitude lint message about implicit none with its suggested fix

Linting as you type

fortitude checks the text in the editor — saved or not. Findings are underlined and marked in the gutter, with the rule and the suggested fix.
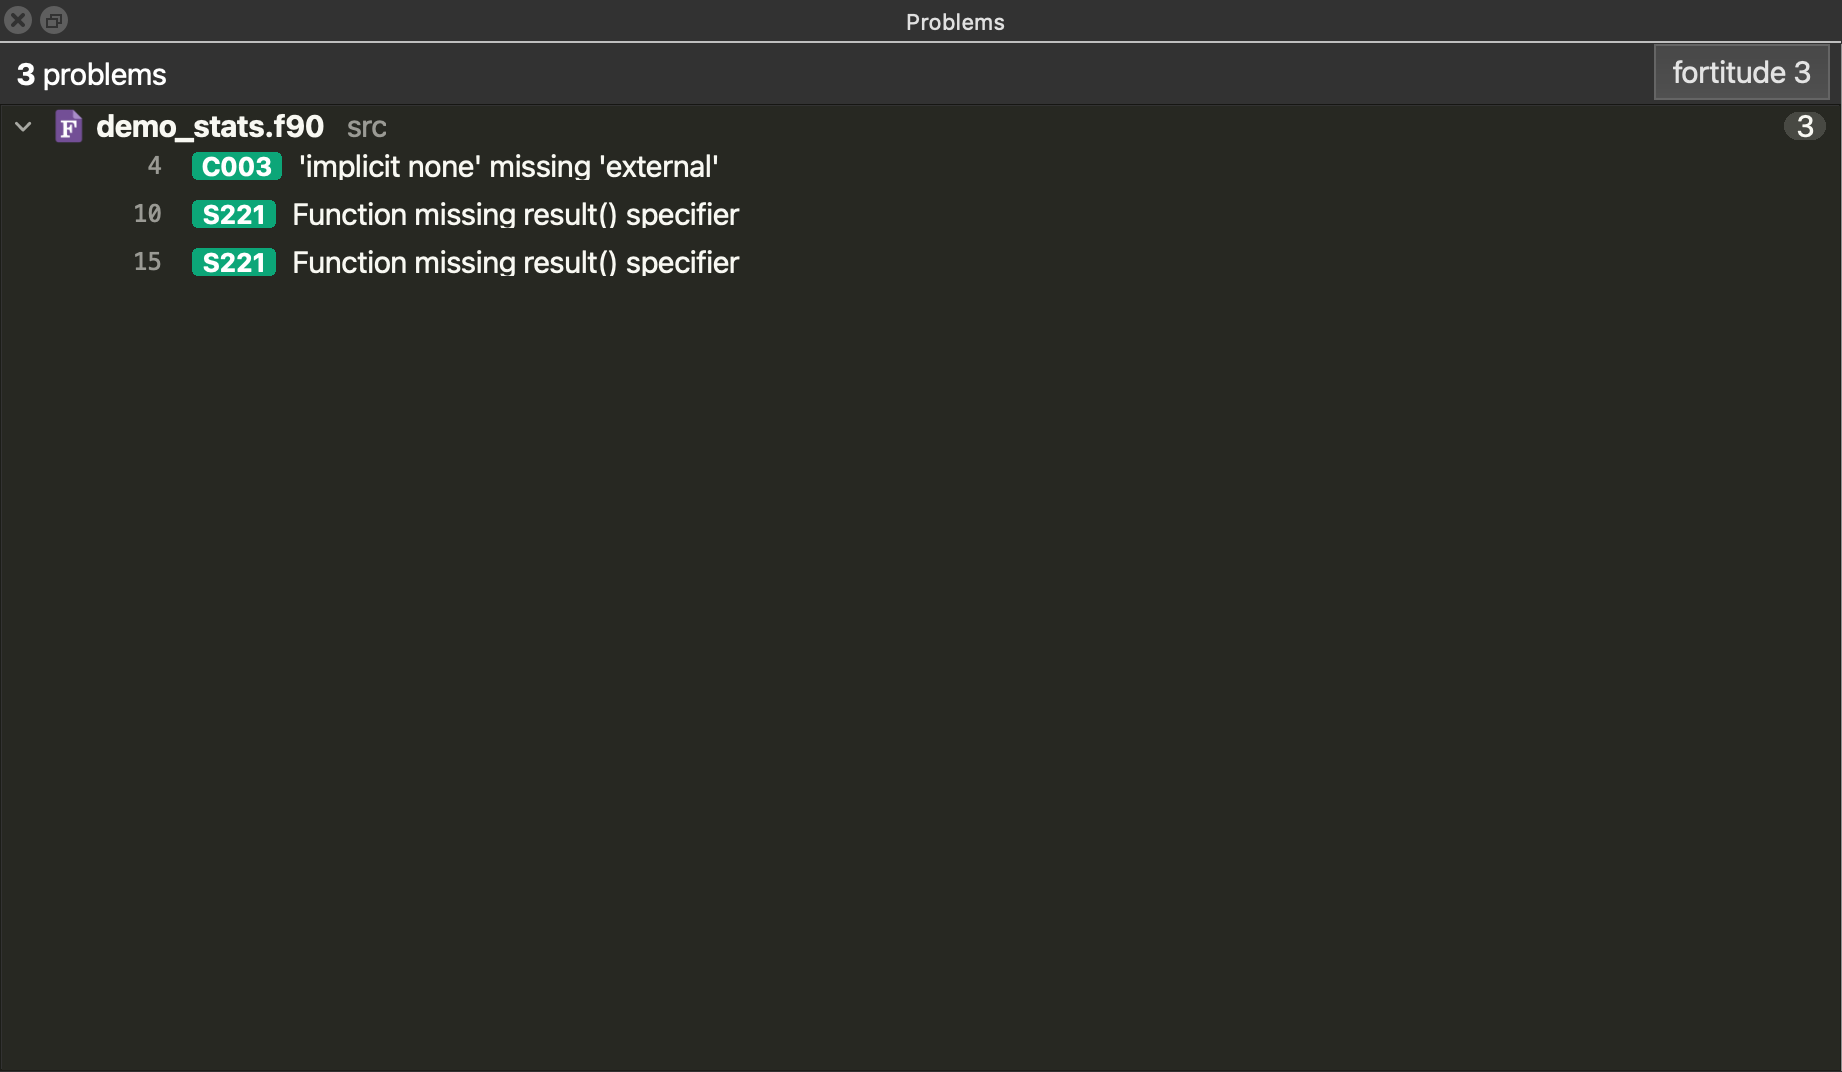
The Problems panel listing fortitude's findings for the project's files

Every problem in one place

The Problems panel gathers the compiler's, fortitude's and fortls's messages; apply fortitude's fix, or ask the AI to explain or fix one.
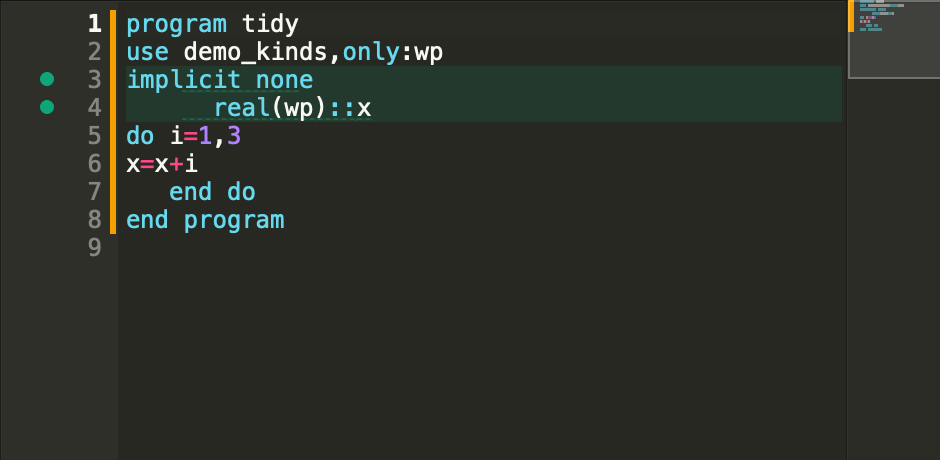
Badly indented Fortran before formatting
Before
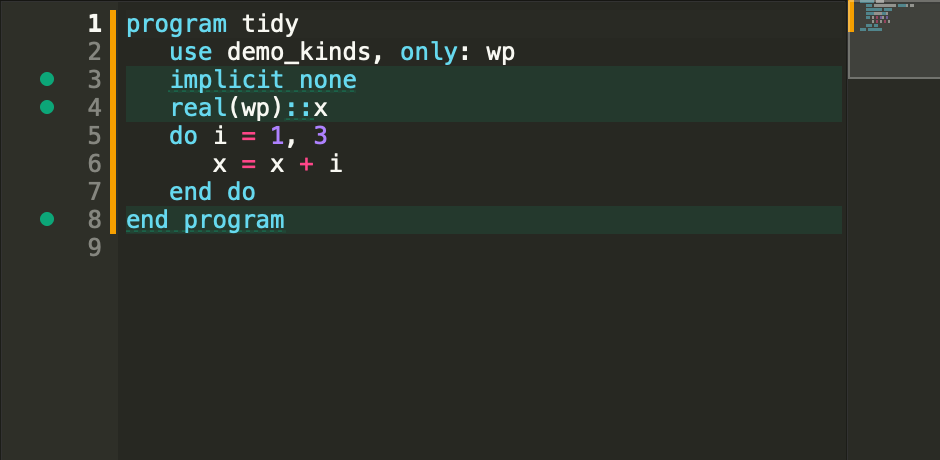
The same code after Format with fprettify
After Format

One-click formatting

fprettify re-indents and re-spaces the file, as a single Undo step.

Language server

Navigate and refactor with fortls

The editor talks to fortls, which indexes your project and its dependencies — only fpm's own folders, so a Python environment inside the project doesn't get in the way.
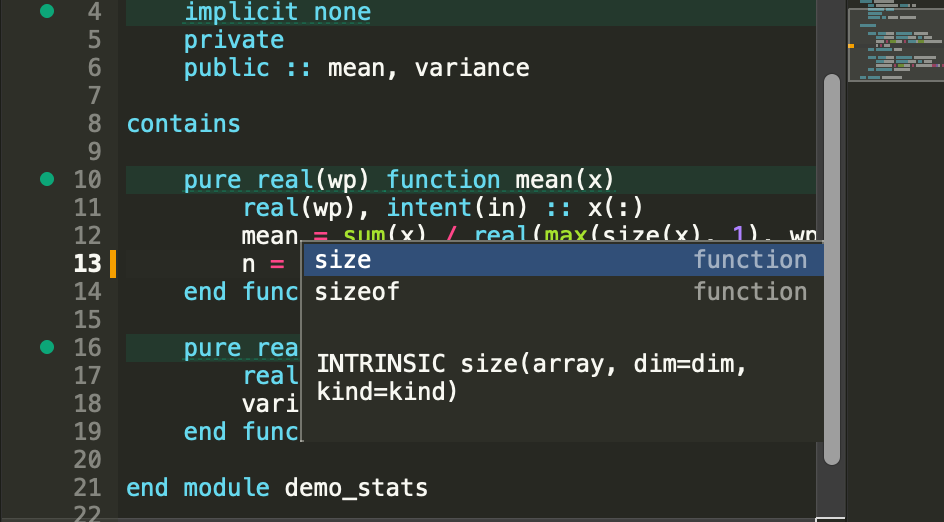
The completion list offering size and sizeof

Completion

After two letters, or a % for a type's components — your names, your dependencies' and the intrinsics.
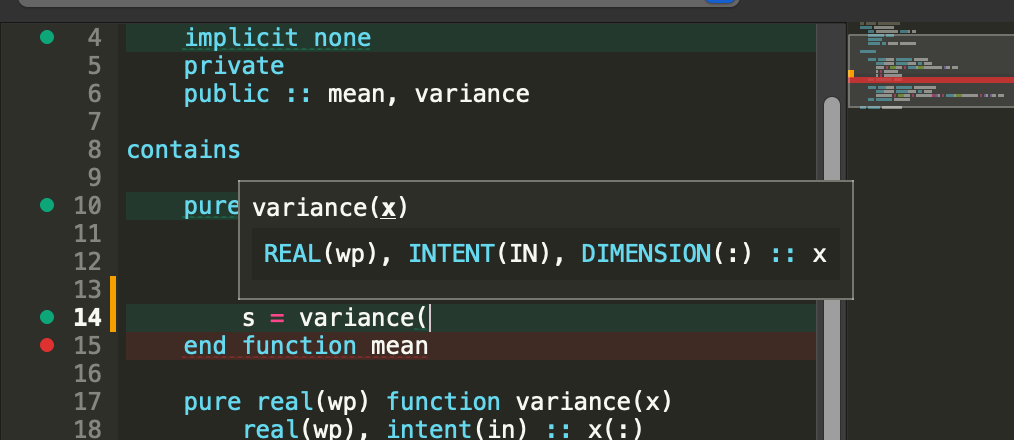
Argument hints for variance with the current argument underlined

Argument hints

Typing a call shows its arguments, the current one underlined, with its declaration and documentation.
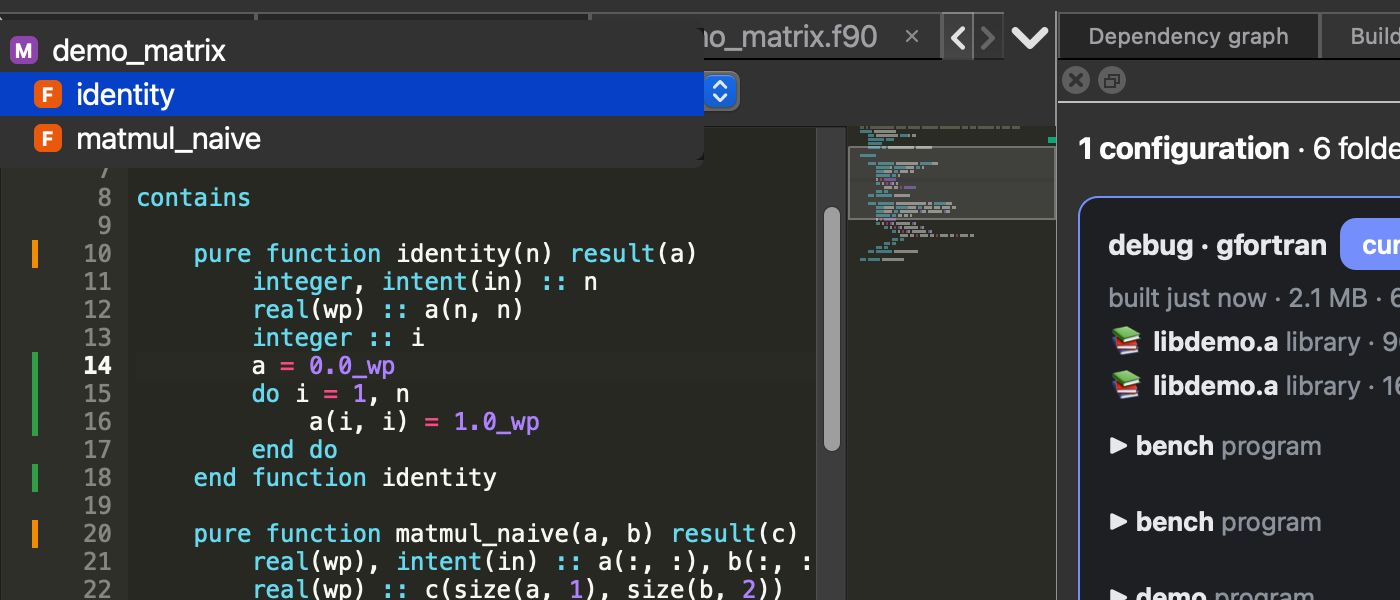
The outline drop-down listing a module and its functions

Outline

The file's modules, types and procedures, with a badge for each kind; it follows the cursor.
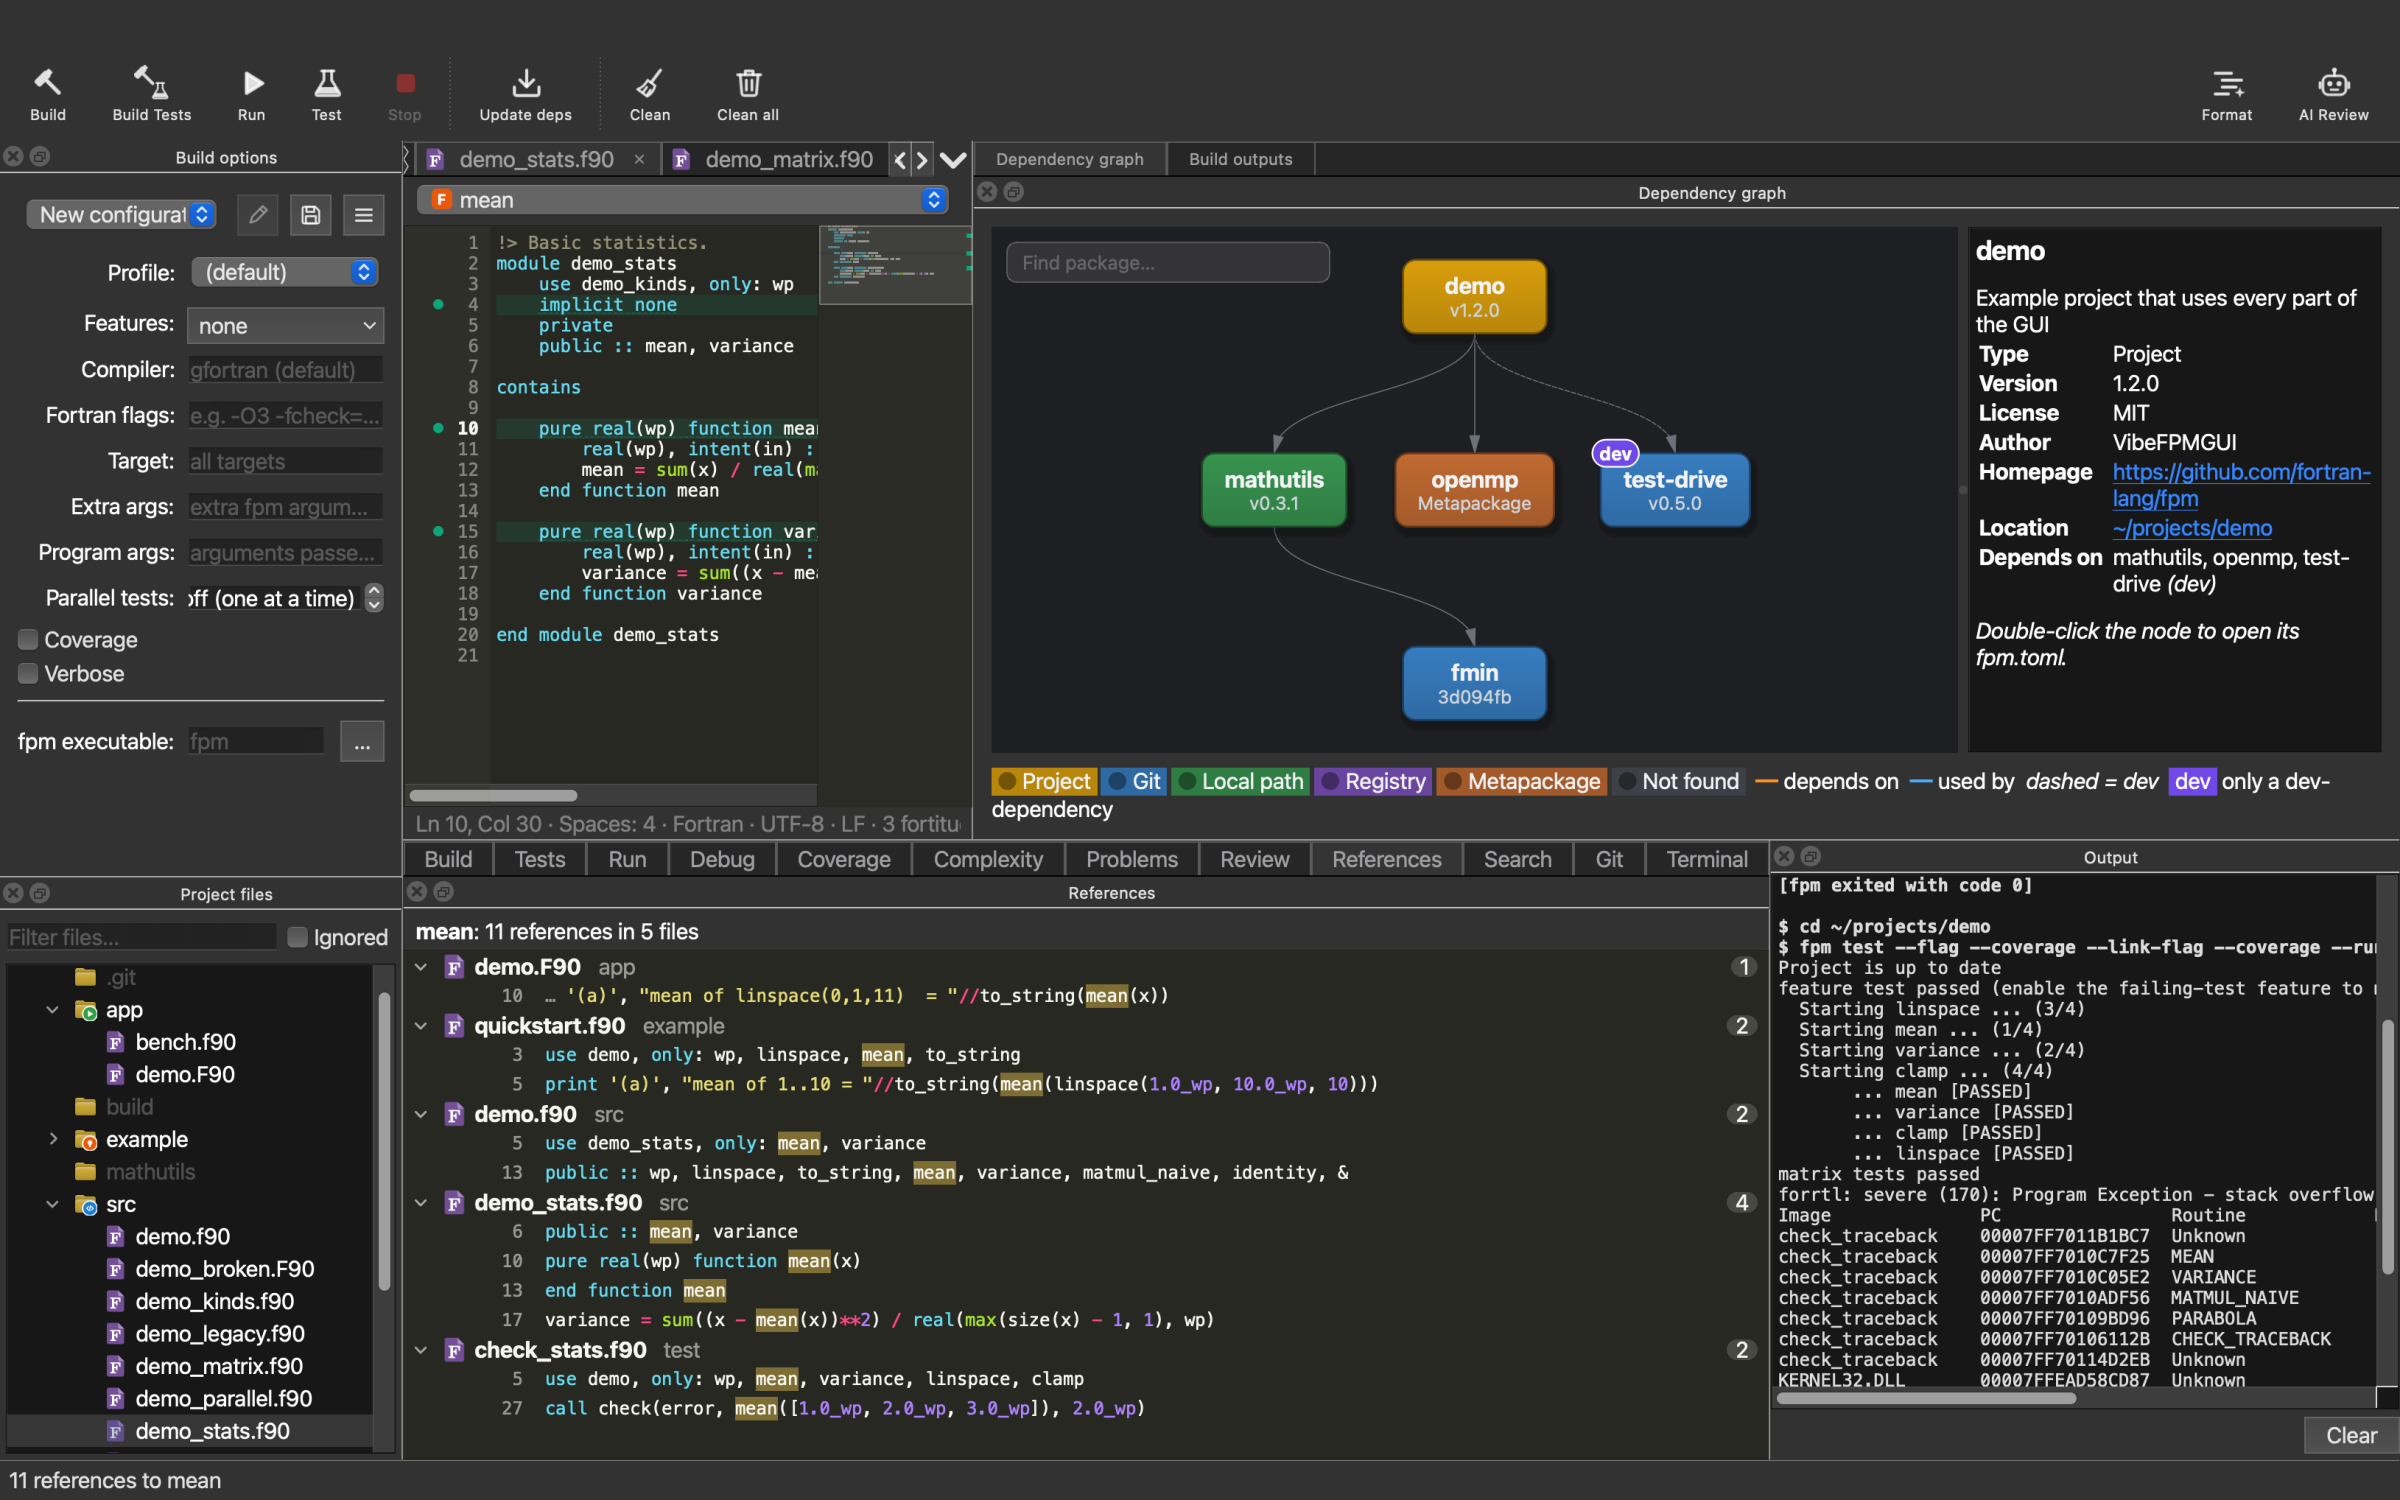
Find References: the uses of mean in several files

Find references & go to definition

F12 or ⌘-click jumps to a definition — even inside a dependency — and back again. ⇧F12 lists every use, grouped by file. ⌘T finds any symbol in the project.
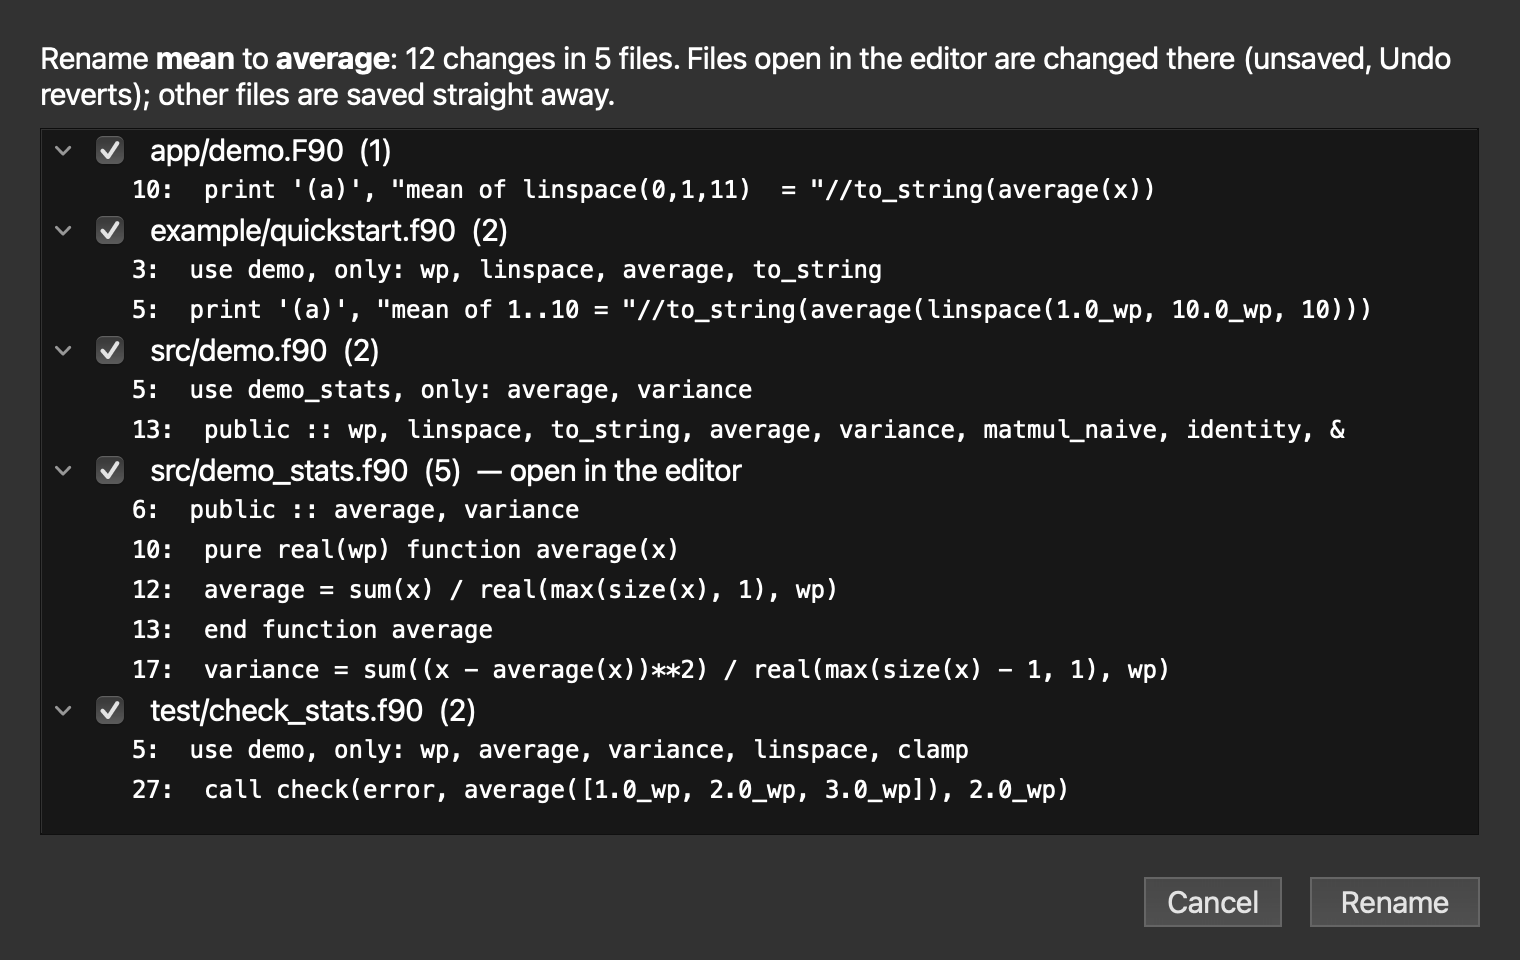
The rename preview: renaming mean to average in several files

Rename with a preview

F2 renames a name everywhere it's used, after showing every line that will change. Open files change in the editor (one Undo); dependency files are left alone unless you tick them.

Git & terminal

What changed, and a shell beside it

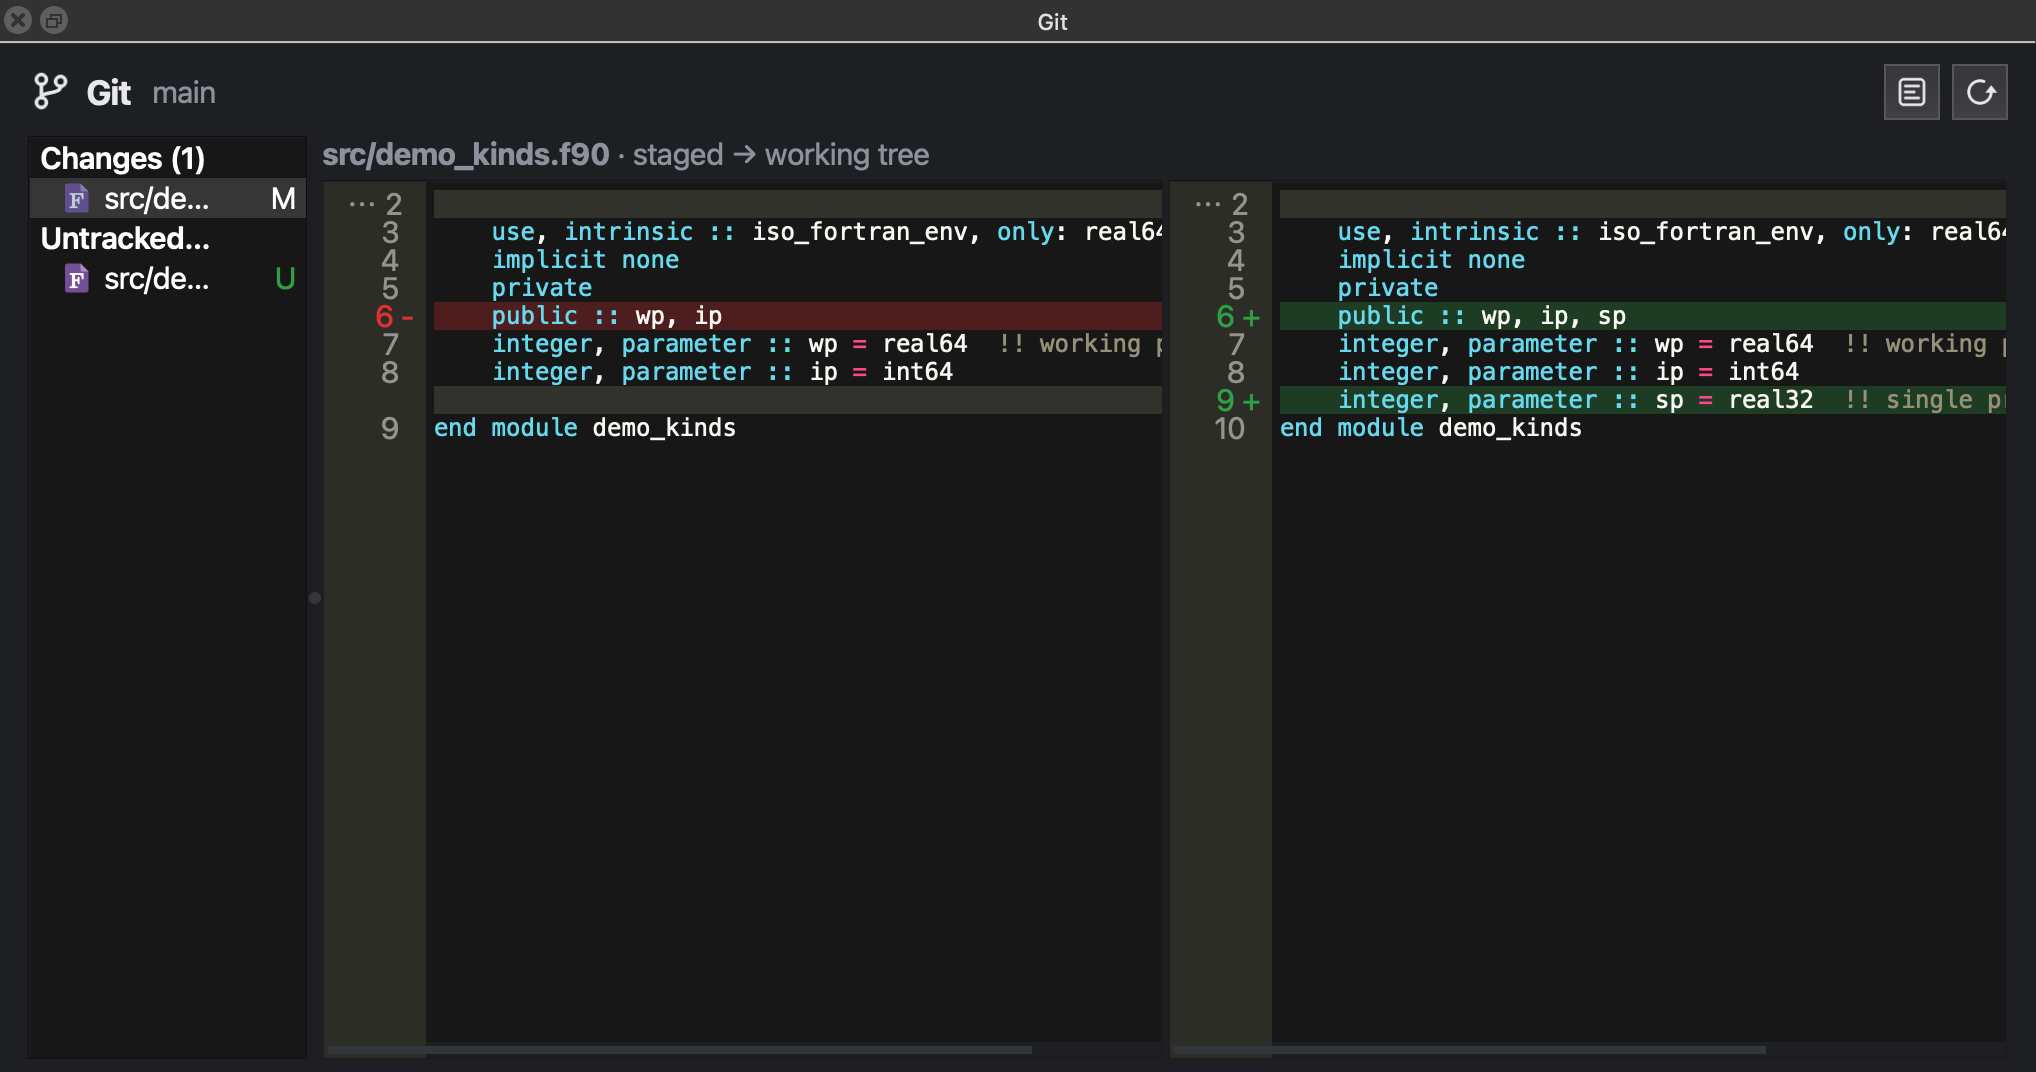
The Git panel shows the repository's branch, what's staged, changed and untracked, and a diff of the selected file — side by side or unified, double-click to open the line.
  • It refreshes when a file is saved or the app is used again after a commit in another program.
  • Right-click a changed file to show it in Project files, or discard its changes (asked first; a file git has no copy of goes to the Trash).
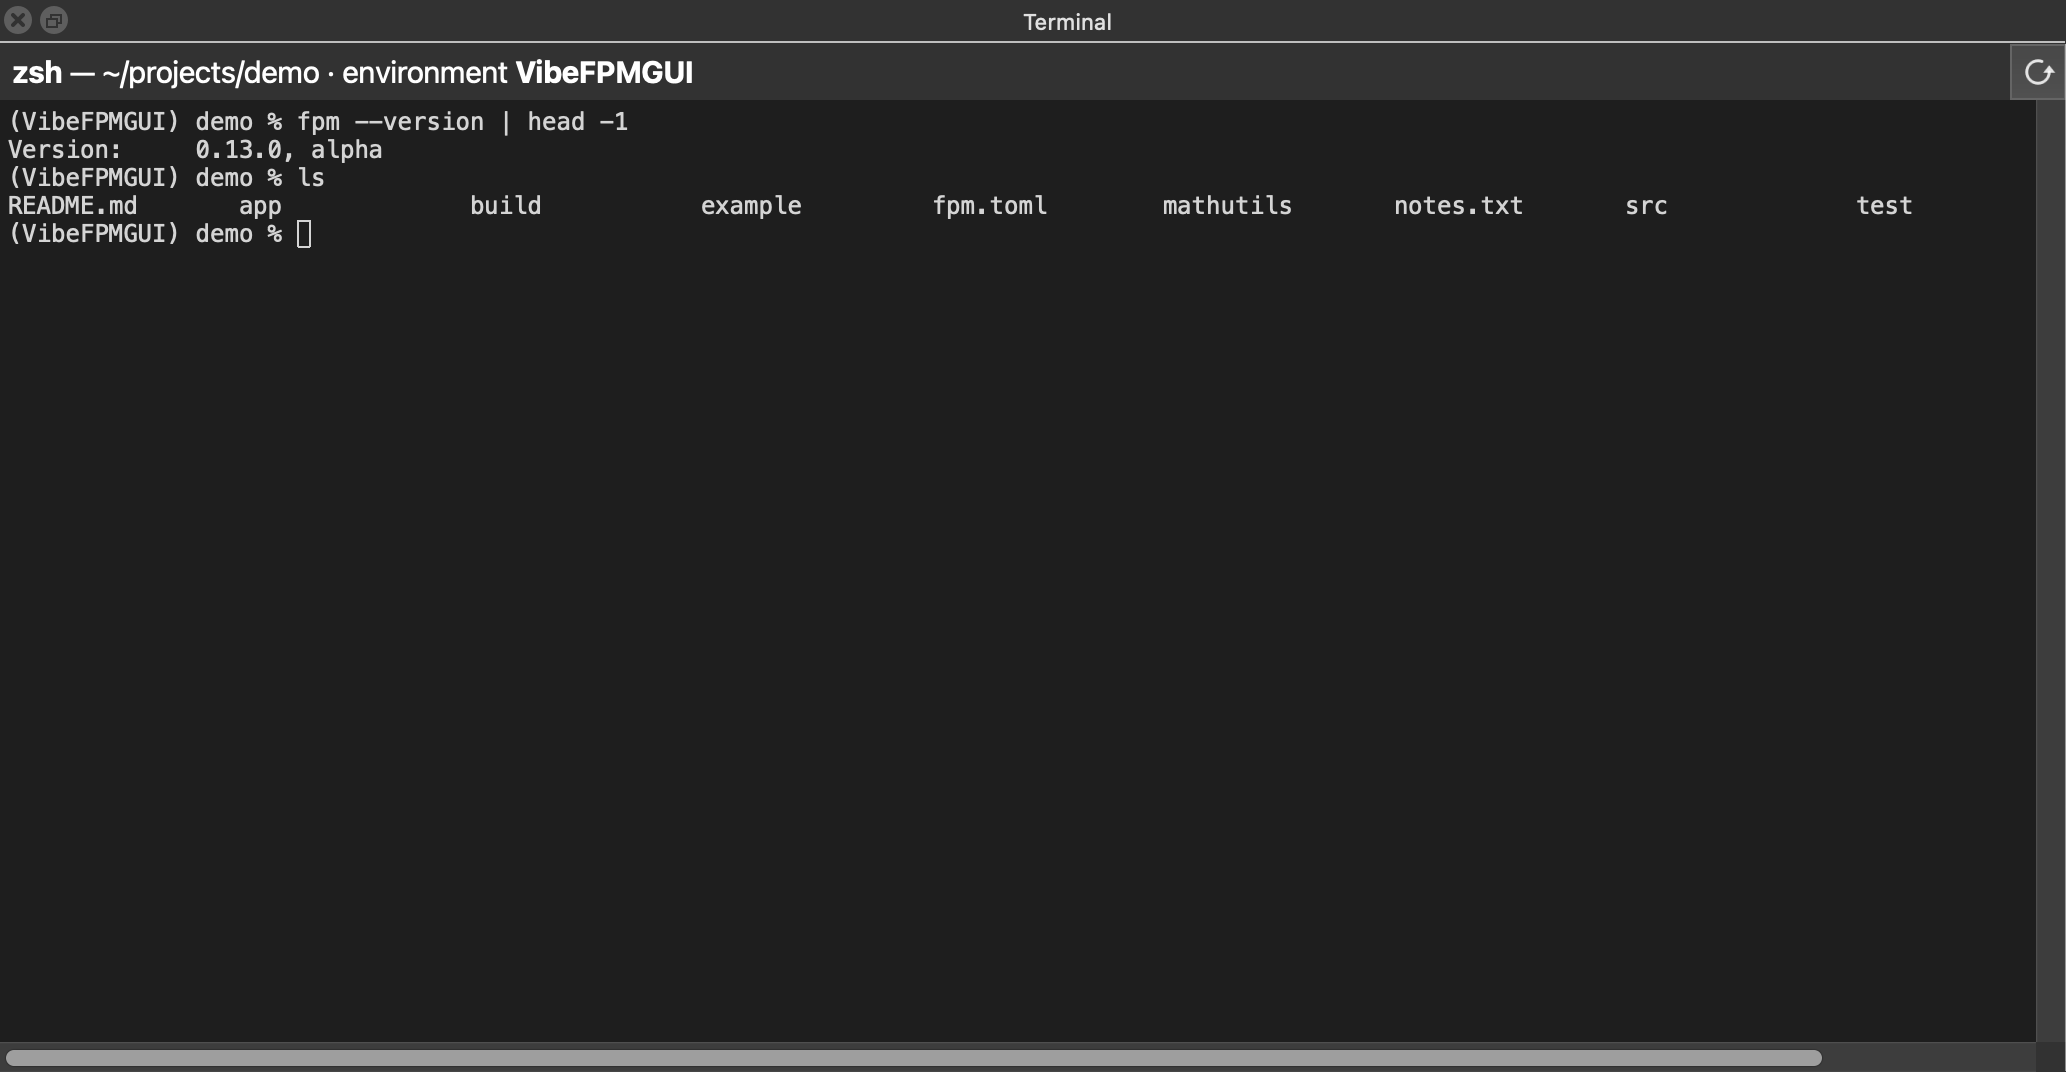
  • The Terminal panel is a shell in the project's folder with exactly the app's environment — the same fpm, compilers and tools — and its prompt says which environment it is.
The Git panel: a modified and an untracked file, and the modified file's diff side by side
The Terminal panel: fpm's version and the project's files listed in a shell

Complexity

Find the knots in your code

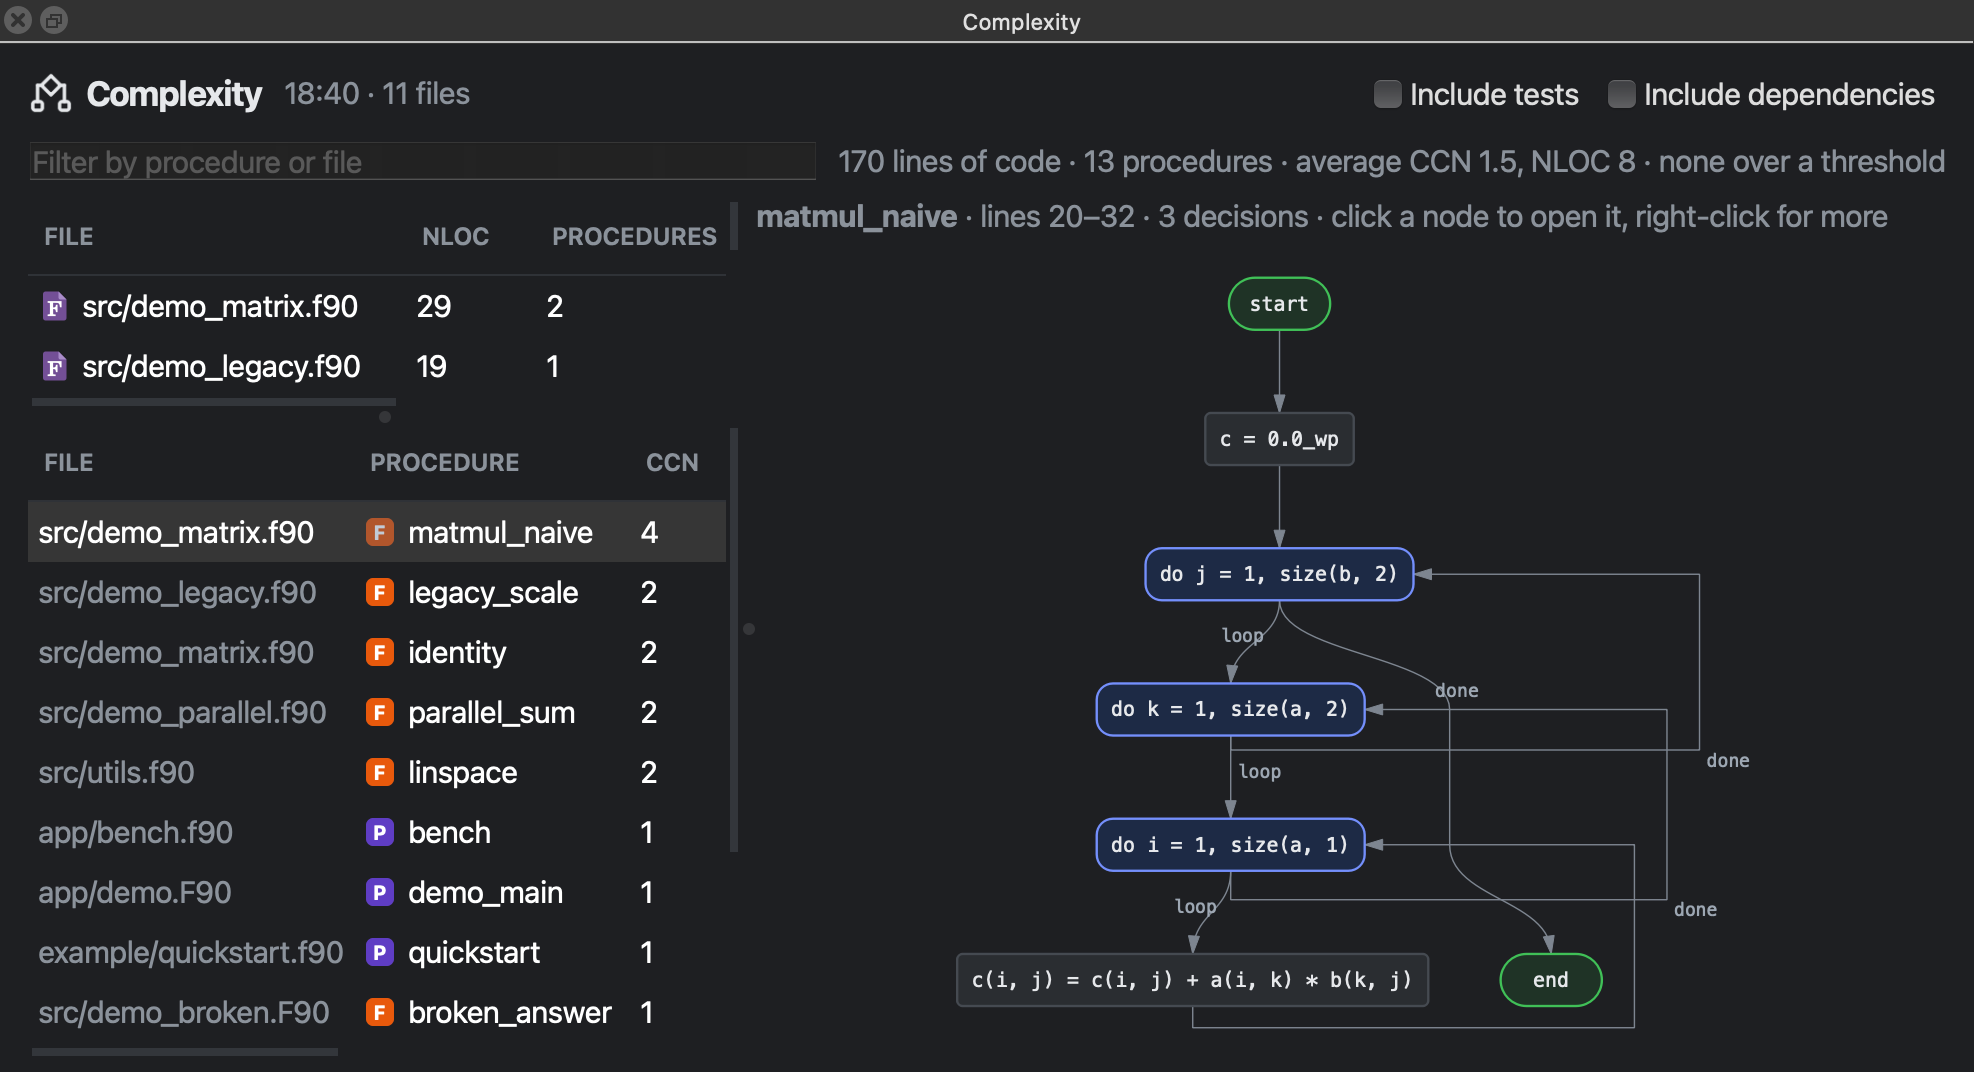
The Complexity panel measures every procedure in the project — lines of code, cyclomatic complexity, parameters, nesting, as lizard measures them — with the most complex first, and draws the selected one's control-flow graph.

  • Files above procedures: choose a file to see just its procedures.
  • The graph's boxes are the statements, its edges the branches — if, select case, loops, exit and cycle; click one to go to its line.
  • Tests and dependencies can be left out of the numbers.
The Complexity panel: files and procedures with their metrics, and a procedure's control-flow graph

Local AI

A second pair of eyes, on your own machine

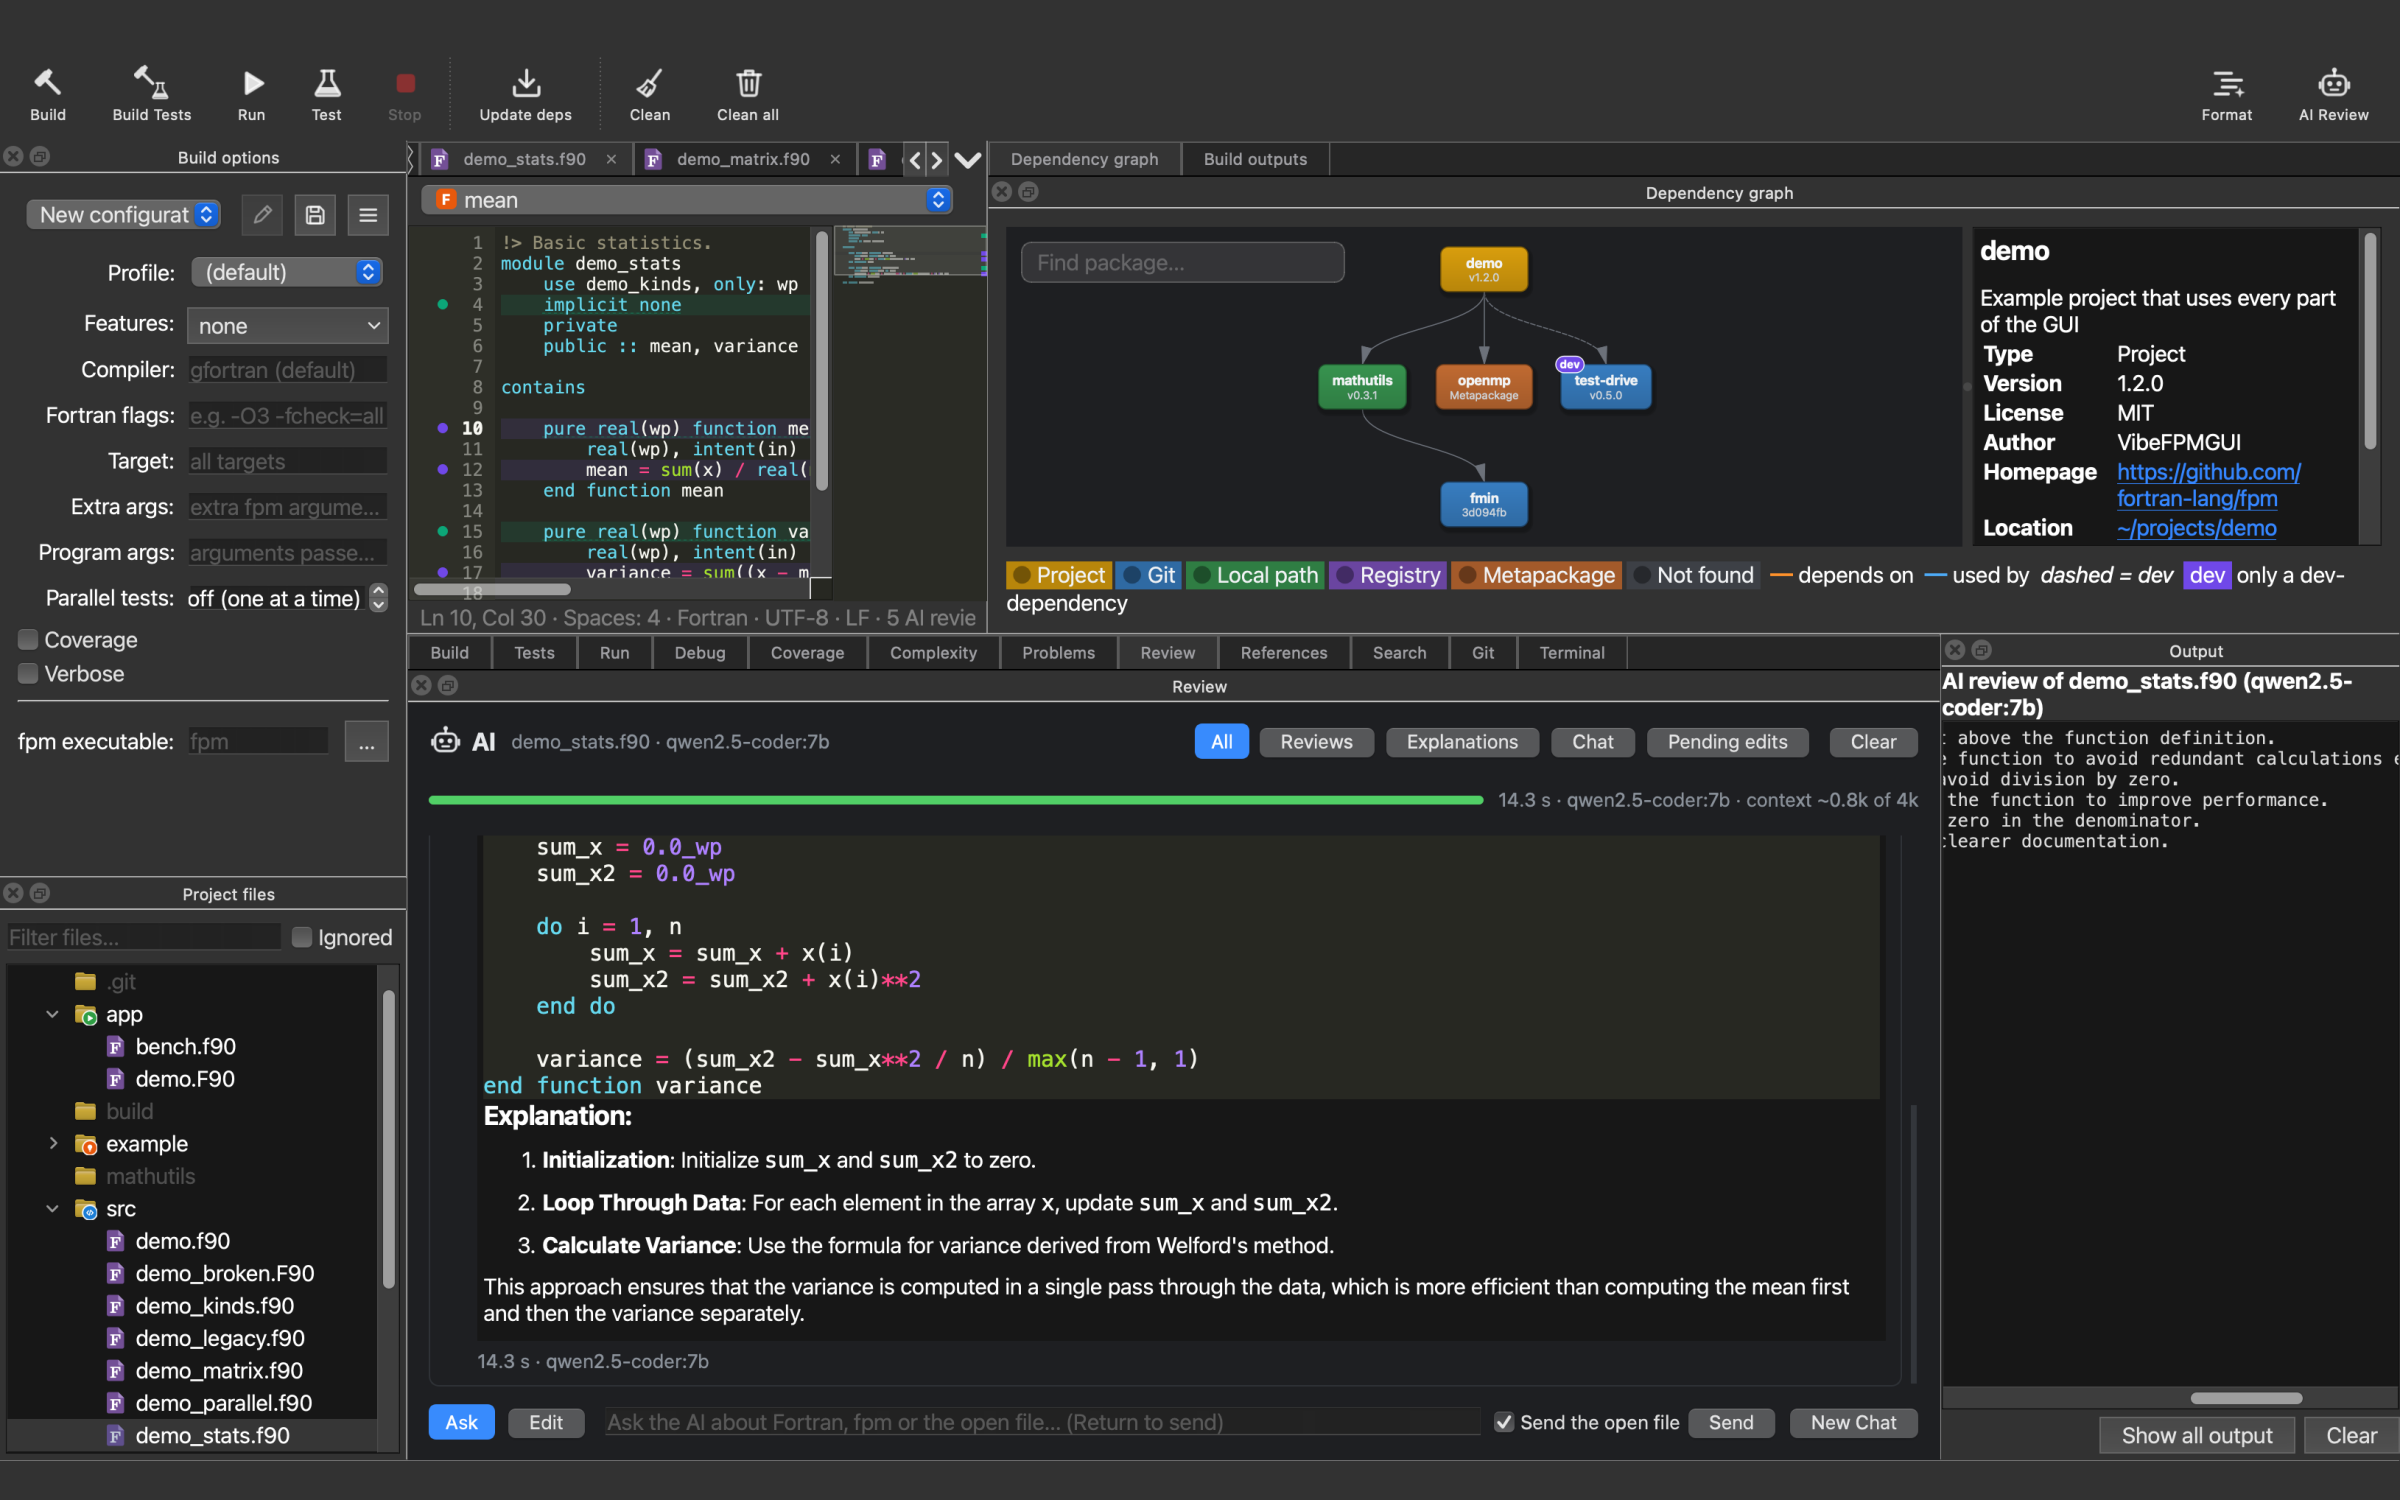
AI → Review Current File sends the file in the editor — and its compiler messages — to a model running locally through Ollama. No code is sent anywhere, and once the model is downloaded it works offline.

  • Findings stream into the Review panel's timeline — click one to jump to the line — and are marked in the gutter.
  • Chat about your code: ask a question, with the open file or without; earlier questions come back with ↑.
  • Let it edit the open file — you accept or reject each change — or Explain and Fix a problem from the Problems panel.
  • Pick any installed model (default qwen2.5-coder:7b), a focus, and how long and how carefully it answers.
  • The app starts the Ollama server when it's needed and stops it when you quit.
The Review panel's timeline: an AI review of demo_stats.f90, then a question about it and the answer

Make it yours

Themes for the window, styles for the code

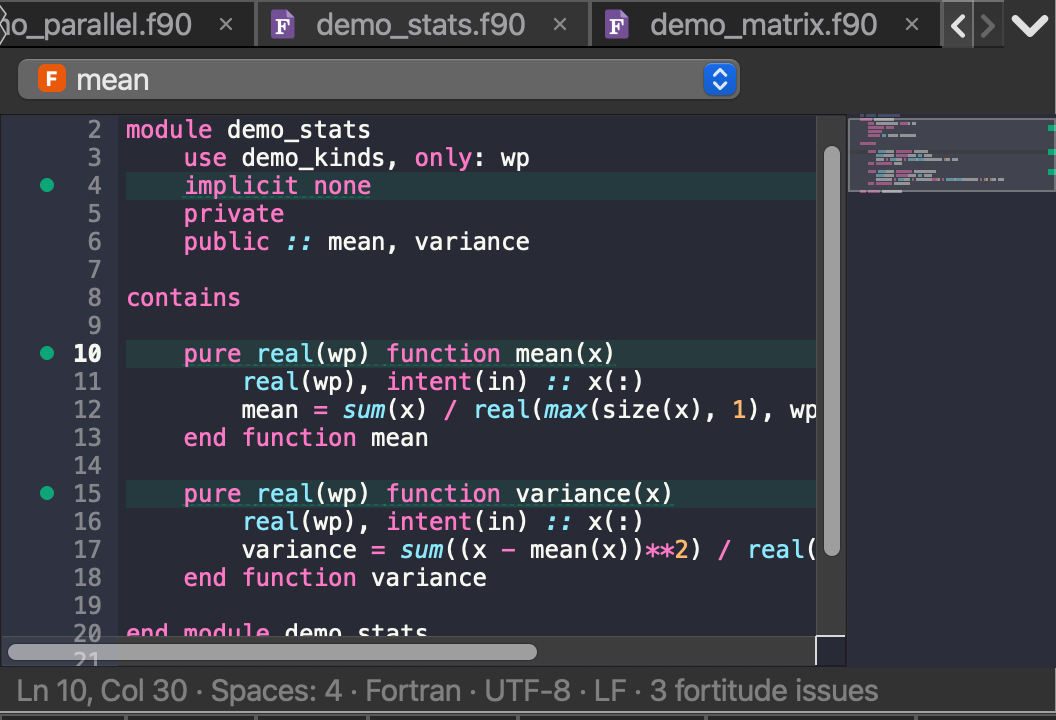
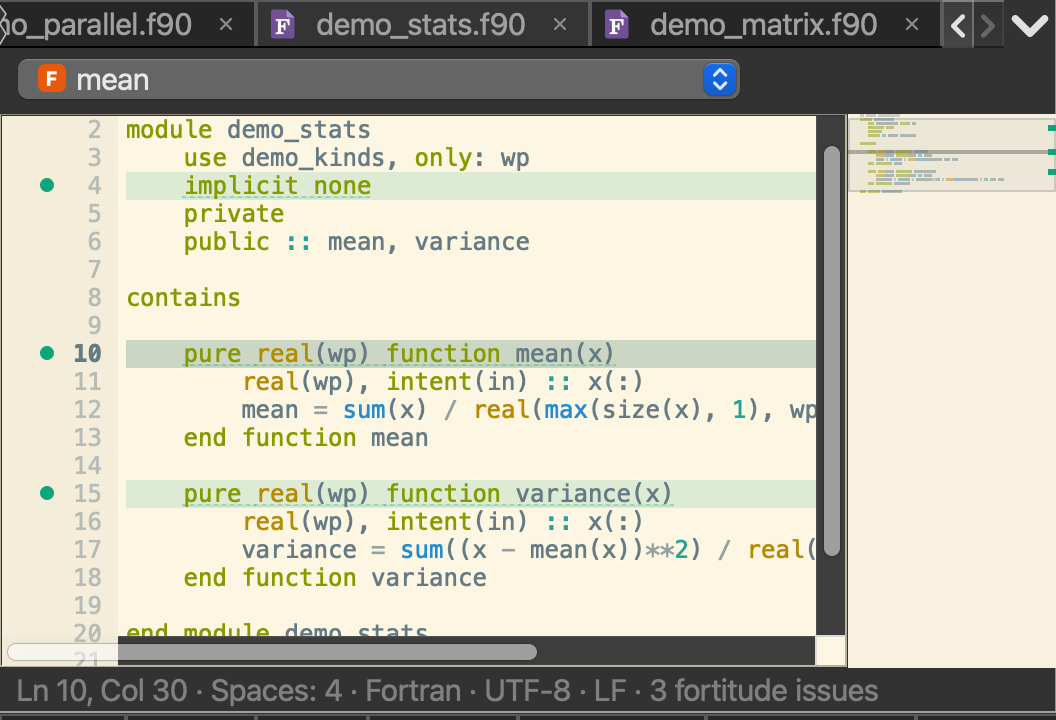
View → Theme colors the whole window — light, dark, Nord, Dracula, Solarized, Gruvbox and more — or follows your system. View → Syntax Colors offers every installed Pygments style for the code. Panels dock anywhere, and collapse by dragging their edge.
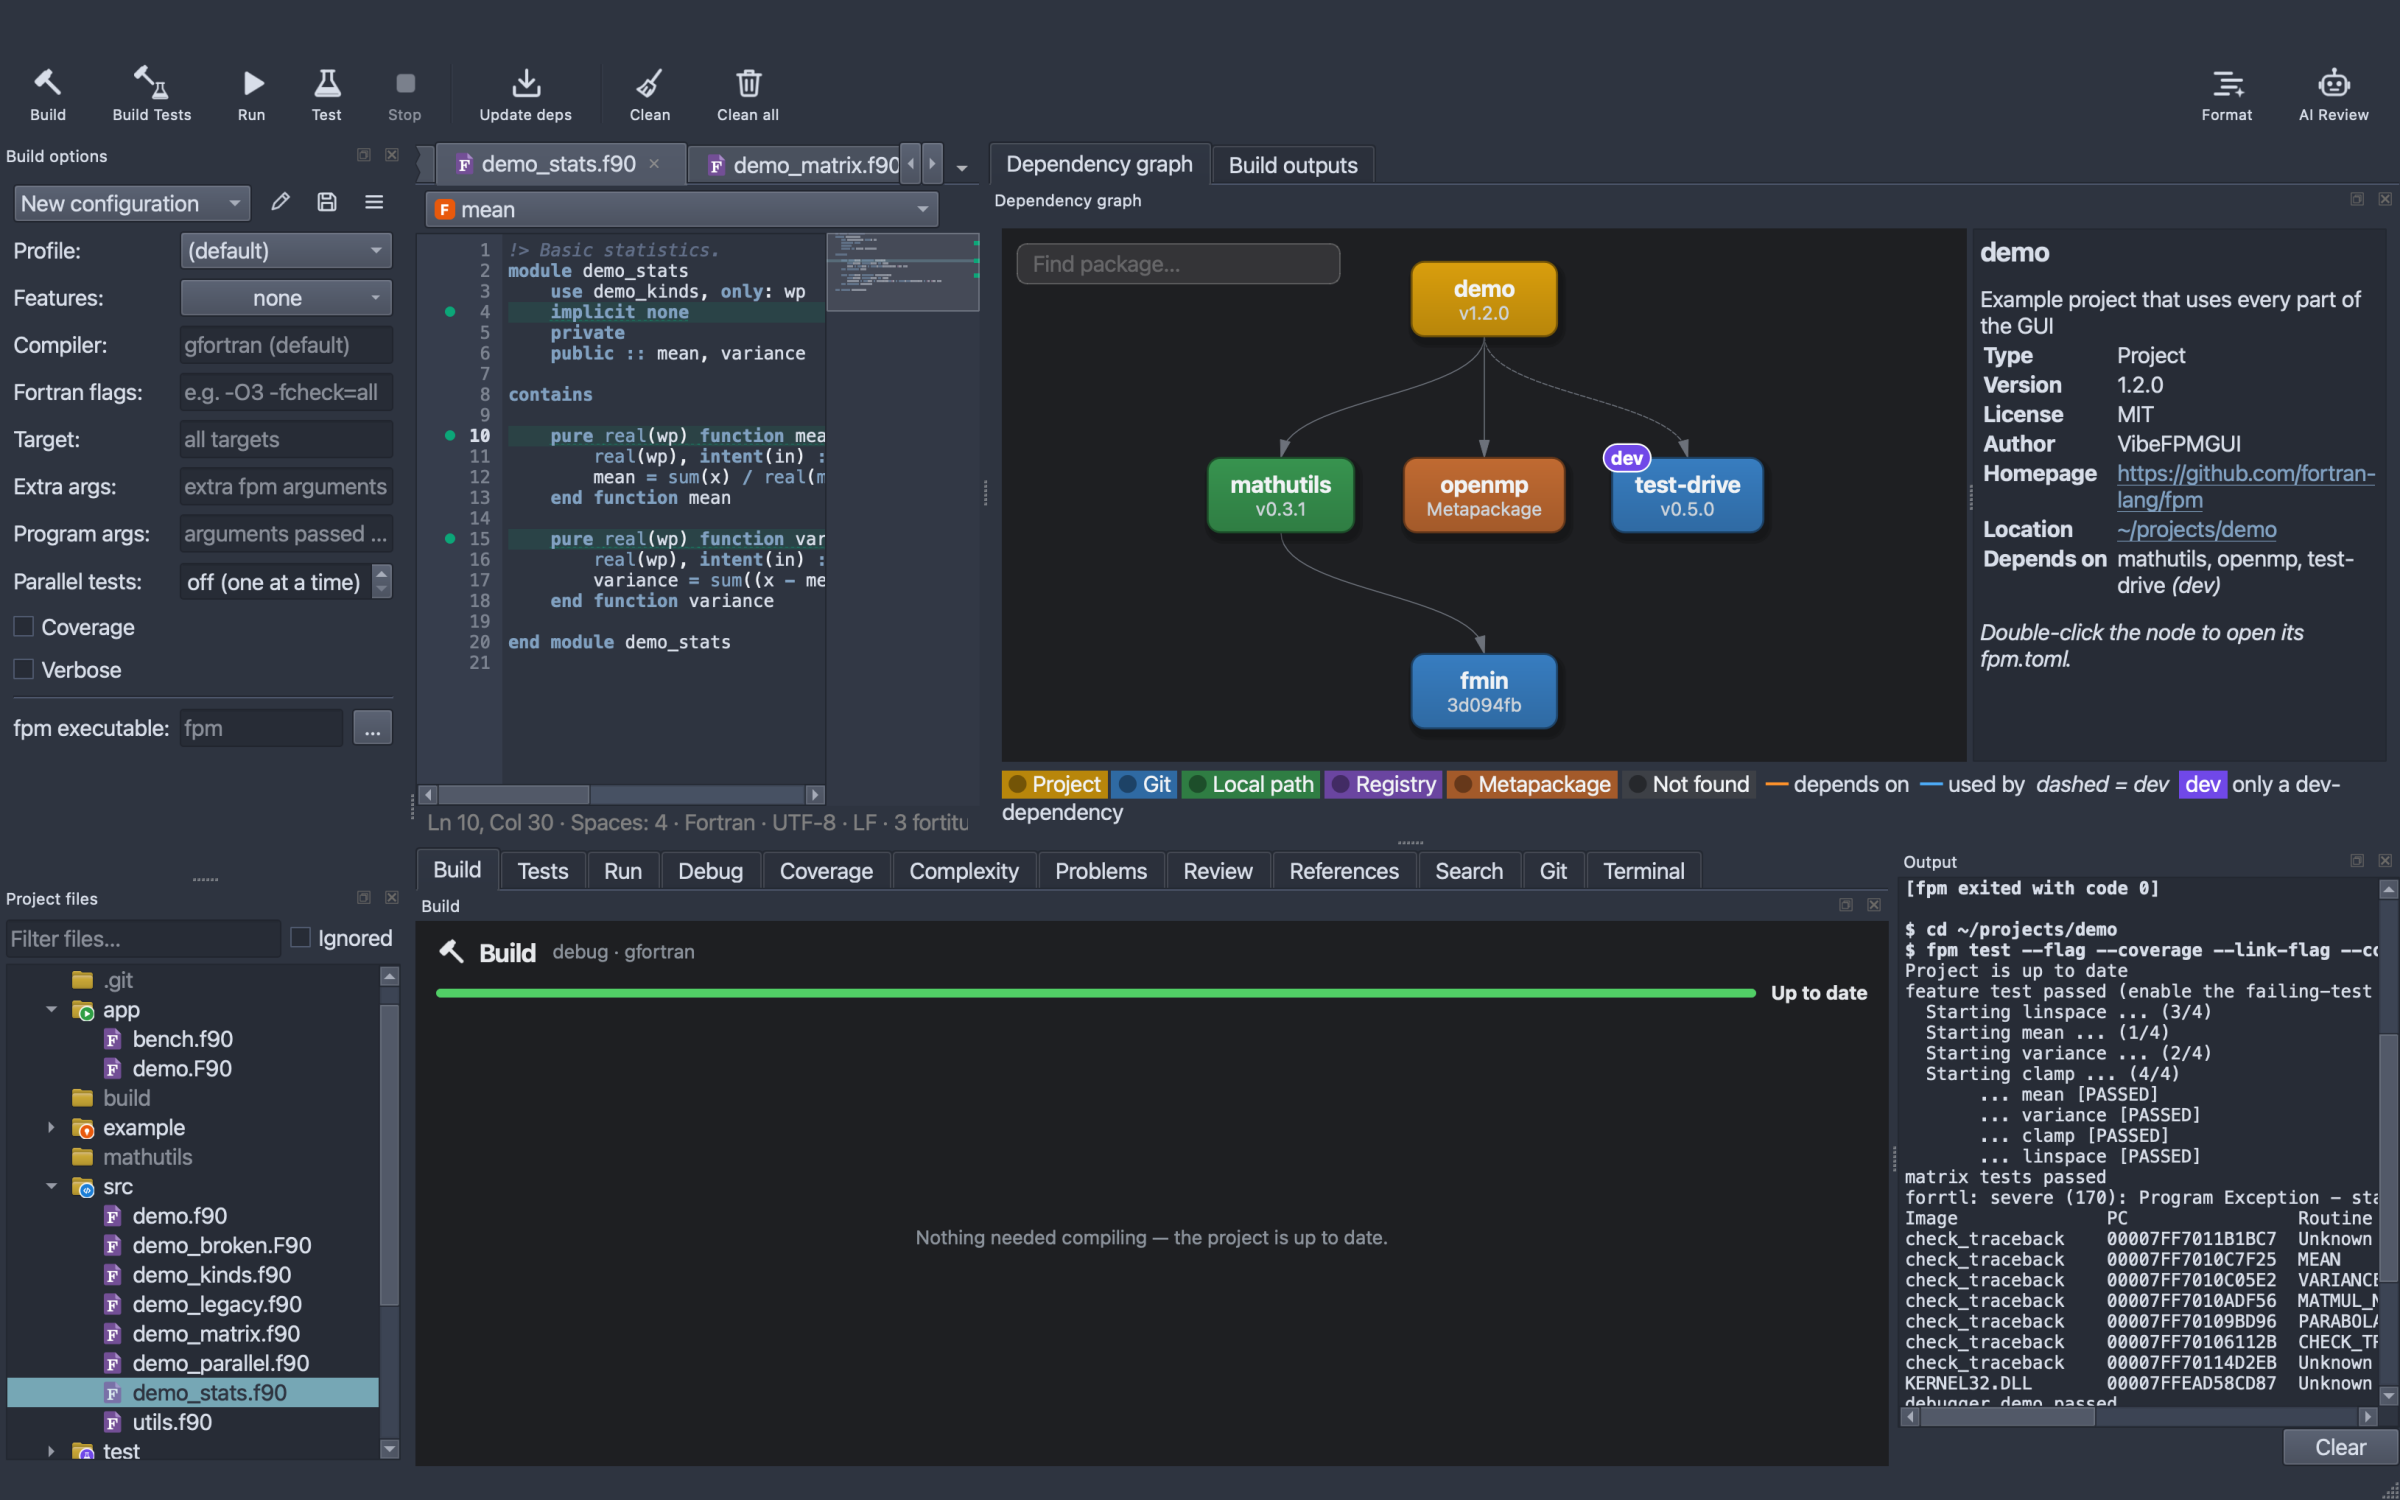
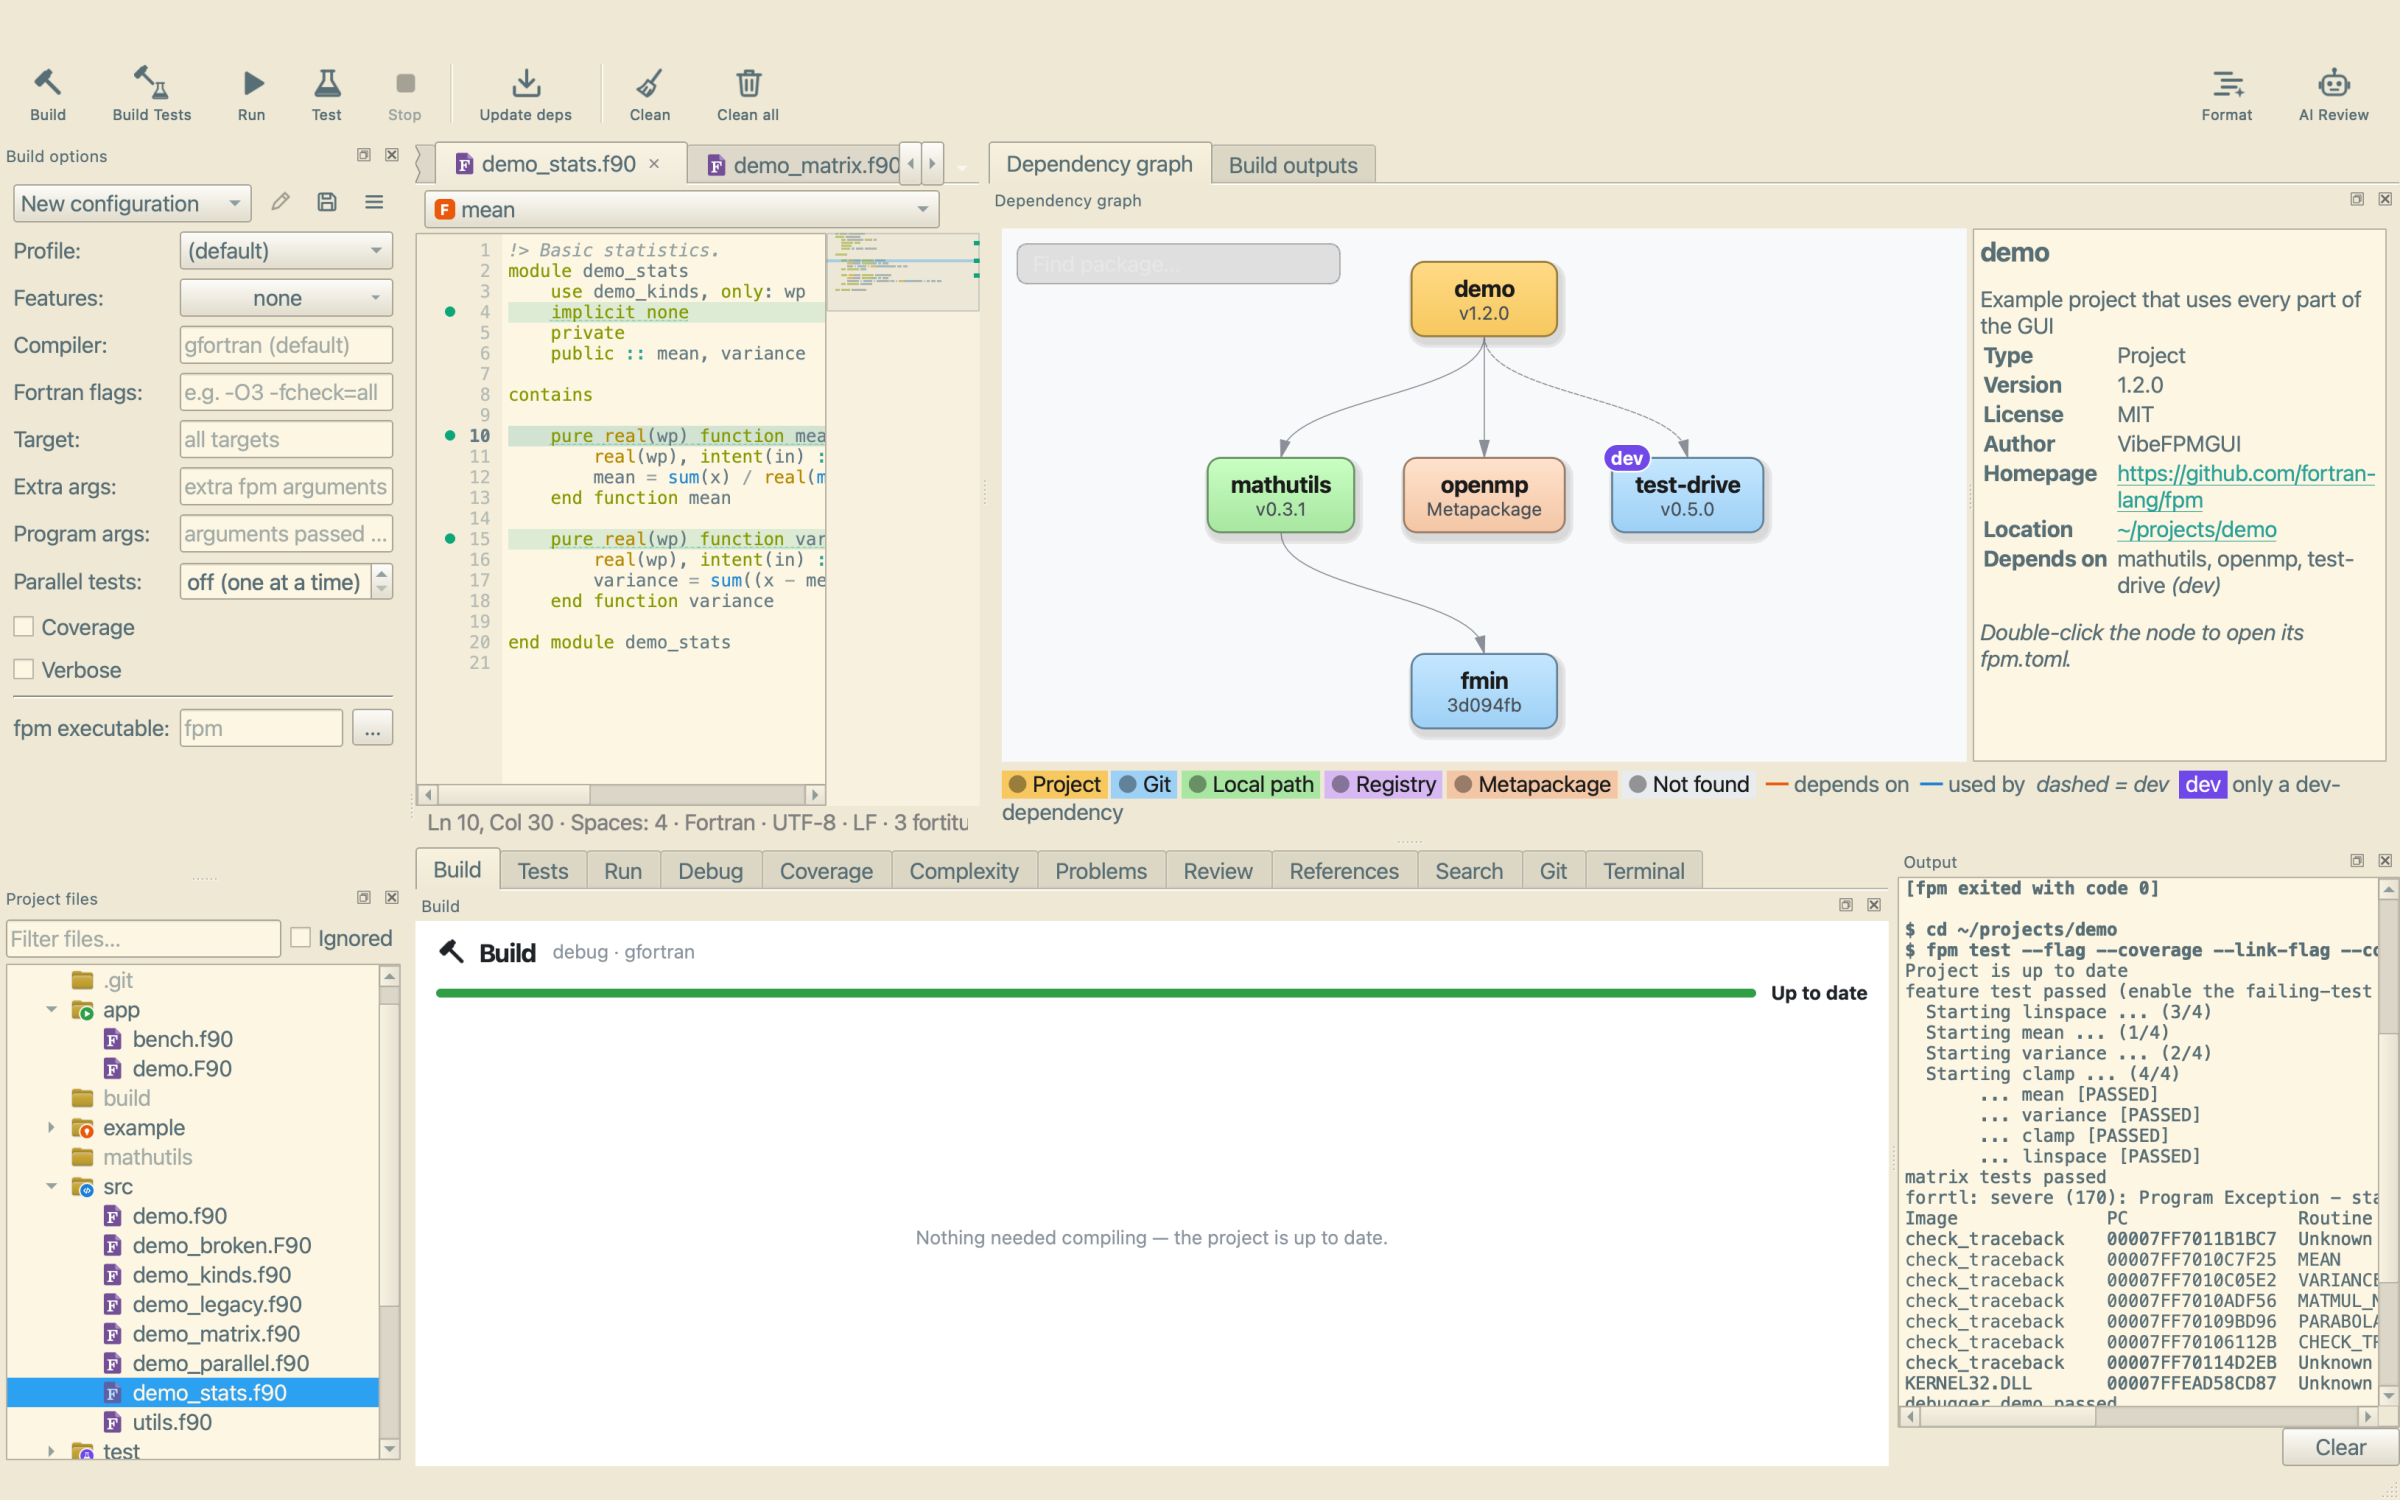
The whole window in the Nord theme
Nord
The whole window in the Solarized Light theme
Solarized Light
The editor in the github-dark style
github-dark
The editor in the dracula style
dracula
The editor in the solarized-light style
solarized-light

Get started

The easiest way is pixi: one environment with fpm, gfortran, fortls, fortitude, fprettify and Ollama — and, on Linux, gdb and Valgrind.

With pixi
# get the code
git clone https://github.com/jacobwilliams/VibeFPMGUI
cd VibeFPMGUI

# start it (reopens your last project)
pixi run start
pixi run start path/to/fpm.toml

# try the demo project
pixi run demo
With pip (Python 3.11+)
pip install .            # the app
pip install .[fortran]   # + fortls, fortitude, fprettify
pip install .[ai]        # + the Ollama client

vibefpmgui path/to/fpm.toml

fpm and a Fortran compiler need to be on your PATH. For AI features, install Ollama; the app offers to download the model the first time. For debugging, gdb 14 or newer (Linux).

On a Mac, the Linux side in Docker (gdb, Valgrind)
# build the image and run the app, its window shown by XQuartz
docker/build-docker.sh

See docker/README.md: the image has the project's Linux environment, and the demo project is ready in Recent Projects.

The demo project in examples/demo uses features, profiles, git, path and metapackage dependencies, warnings, parallel compiles and tests — and a test written for the debugger — so every part of the app has something to show.
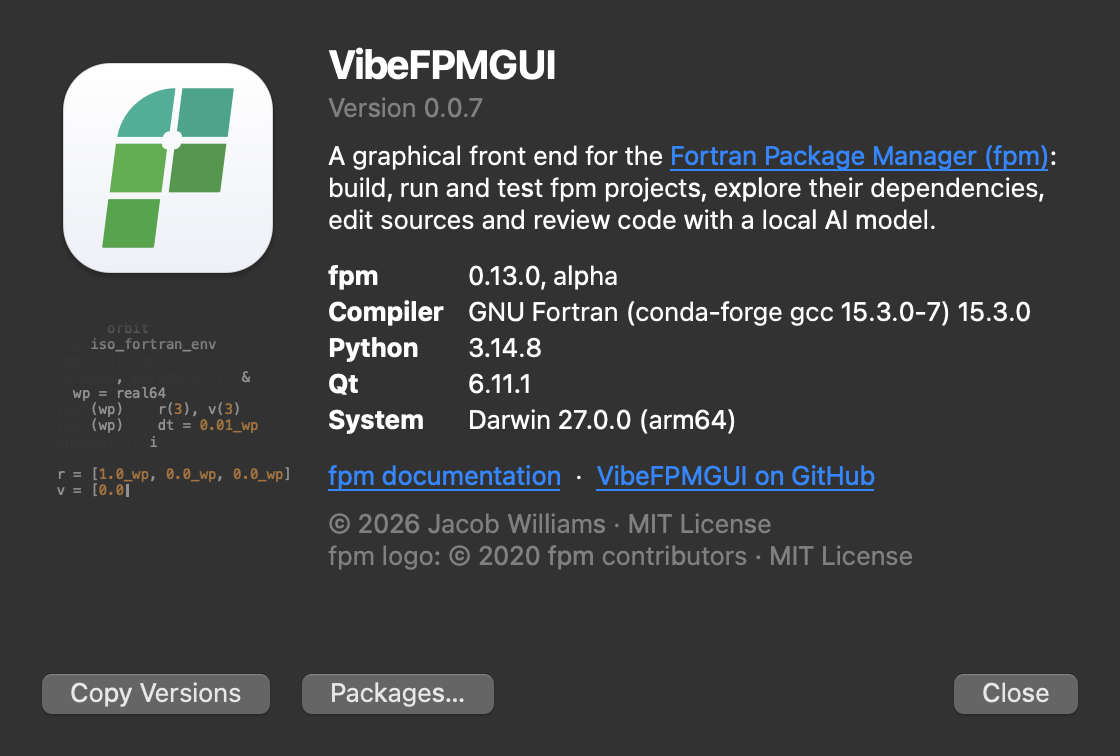
The About window: VibeFPMGUI version, fpm and compiler versions

Built with

Python and Qt (PySide6 through qtpy), pyqtgraph for the graphs and Pygments for highlighting — on top of fpm, fortls, fortitude, fprettify, gdb, Valgrind and Ollama.

Source on GitHub